"Ain’t it cool?" – Integrating SharePoint and real-time performance data – Part 1
Hi
This is one of those nerdy posts in the category of "look at me! look at me! look at what I did, isn’t it cool?". Normally application developers write posts like this, demonstrating some cool bit of code they are really proud of. Being only a part-time developer and more of a security/governance/compliance kind of guy, my "aint it cool" post is a little different.
So if you are a non developer and you are already tempted to skip this one, please reconsider. If you are a CIO, IT manager, Infrastructure manager or are simply into ITIL, COBiT or compliance around IT operations in general, this post may have something for you. It offers something for knowledge managers too. Additionally it gives you a teensy tiny glimpse into my own personal manifesto of how you can integrate different types of data to achieve the sort of IT operational excellence that is a step above where you may be now.
Additionally, if you are a Cisco nerd or an infrastructure person who has experience with monitoring, you will also find something potentially useful here.
In this post, I am going to show you how I leveraged three key technologies, along with a dash of best practice methodology to create an IT Portal that I think is cool.
The Premise – "Passive Compliance"
In my career I have filled various IT roles and drunk the kool-aid of most of the vendors, technologies, methodologies and practices. Nowadays I am a product of all of these influences, leaving me slightly bitter and twisted, somewhat of a security nerd, but at the same time fairly pragmatic and always mindful of working to business goals and strategy.
One or the major influences to my current view of the world, was a role working for OSI Software from 2000-2004, via a former subsidiary company called WiredCity. OSISoft develop products in the process control space, and their core product is a data historian called PI. At WiredCity, we took this product out of the process control market and right into the IT enterprise and OSISoft now market this product as "IT Monitor". I’ll talk about PI/IT monitor in detail in a moment, but humour me and just accept my word that it is a hellishly fast number crunching database for storing lots of juicy performance data.
An addition I like to read all the various best practice frameworks and methodologies and I write about them a fair bit. As a result of this interest, I have a SharePoint IT portal template that I have developed over the last couple of years, designed around the guiding principle of passive compliance. That is, by utilising the portal for IT various operational tasks, structured in a certain way, you implicitly address some COBiT/ISO27001 controls as well as leverage ITIL principles. I designed it in such a way that an auditor could take a look at it and it would demonstrate the assurance around IT controls for operational system support. It also had the added benefit of being a powerful addition to disaster recovery strategy. (In the second article, to be published soon, I will describe my IT portal in more detail).
Finally, I have SQL Reporting Services integrated with SharePoint, used to present enterprise data from various databases into the IT Portal – also as part of the principle of passive compliance via business intelligence.
Recently, I was called in to help conduct a demonstration of the aforementioned PI software, so I decided to add PI functionality to my existing "passive compliance" IT portal to integrate asset and control data (like change/configuration management) along with real-time performance data. All in all I was very pleased with the outcome as it was done in a day with pretty impressive effect. I was able to do this with minimal coding, utilising various features of all three of the above applications with a few other components and pretty much wrote no code at all.
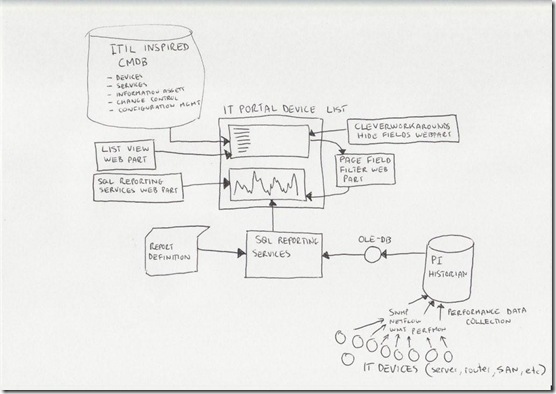
Below I have built a conceptual diagram of the solution. Unfortunately I don’t have Visio installed, but I found a great freeware alternative 😉
I know, there is a lot to take in here (click to enlarge), but if you look in the center of the diagram, you will see a mock up of a SharePoint display. All of the other components drawn around it combine to produce that display. I’ll now talk about the main combination, PI and SQL Reporting Services.
A slice of PI
 Okay so let’s explain PI because I think most people have a handle on SharePoint :-).
To the right is the terminator looking at data from a PI historian showing power flow in California. So this product is not a lightweight at all. It’s heritage lies in this sort of critical industrial monitoring.
Just to get the disclaimers out of the way, I do not work for OSISoft anymore nor are they even aware of this post. Just so hard-core geeks don’t flame me and call me a weenie, let me just say that I love RRDTool and SmokePing and prefer Zabbix over Nagios. Does that make me cool enough to make comment on this topic now? 🙂
Like RRDTool, PI is a data historian, designed and optimised for time-series data.
"Data historian? Is that like a database of some kind?", you may ask. The answer is yes, but its not a relational database like SQL Server or Oracle. Instead, it is a "real-time, time series" data store. The English translation of that definition, is that PI is extremely efficient at storing time based performance data.
"So what, you can store that in SQL Server, mySQL or Oracle", I hear you say. Yes you most certainly can. But PI was designed from the ground up for this kind of data, whereas relational databases are not. As a result, PI is blisteringly fast and efficient. Pulling say, 3 months of data that was collected at 15 second intervals would literally take seconds to do, with no loss of fidelity, even going back months.
As an example, let’s say you needed to monitor CPU usage of a critical server. PI could collect this data periodically, save it into the historian for later view/review/reporting or analysis. Getting data into the historian can be performed a number of ways. OSISoft have written ‘interfaces’ to allow collection of data from sources such as SNMP, WMI, TCP-Response, Windows Performance Monitor counters, Netflow and many others.
The main point is that once the data is inside the historian, it really doesn’t matter whether the data was collected via SNMP, Performance Monitor, a custom script, etc. All historian data can now be viewed, compared, analysed and reported via a variety of tools in a consistent fashion.
SQL Reporting Services
For those of you not aware, Reporting Services has been part of SQL Server since SQL 2000 and allows for fairly easy generation of reports out of SQL databases. More recently, Microsoft updated SQL Server 2005 with tight integration with SharePoint. Now when creating a report server report, it is "published" to SharePoint in a similar manner to the publishing of InfoPath forms.
Creating reports is performed via two ways, but I am only going to discuss the Visual Studio method. Using Visual Studio, you are able to design a tailored report, consisting of tables and charts. An example of a SQL Reporting Services Report in visual studio is below. (from MSDN)
.gif)
The interesting thing about SQL Reporting services is that it can pull data from data sources other than SQL Server databases. Data sources include Oracle, Web Services, ODBC and OLE-DB. Depending on your data source, reports can be parameterised (did I just make up a new word? 🙂 ). This is particularly important to SharePoint as you will soon see. It essentially means that you can feed your report values that customise the output of that report. In doing so, reports can be written and published once, yet be flexible in the sort of data that is returned.
Below is a basic example:
Here is a basic SQL statement that retrieves three fields from a data table called "picomp2". Those fields are "Tag", "Time" and "Value". This example selects values only where "Time" is between 12-1pm on July 28th and where "tag" contains the string "MYSERVER"
SELECT    "tag", "time", "value"
FROM      picomp2
WHERE     (tag LIKE '%MYSERVER%') AND ("time" >= '7/28/2008 12:00:00 PM') AND ("time" <= '7/28/2008 1:00:00 PM')
Now what if we wanted to make the value for TAG flexible? So instead of "MYSERVER", use the string "DISK" or "PROCESSOR". Fortunately for most data sources, SQL Reporting Services allows you to pass parameters into the SQL. Thus, consider this modified version of the above SQL statement.
SELECT    "tag", "time", "value"
FROM      picomp2
WHERE     (tag LIKE '%' + ? + '%') AND ("time" >= '7/28/2008 12:00:00 PM') AND ("time" <= '7/28/2008 1:00:00 PM')
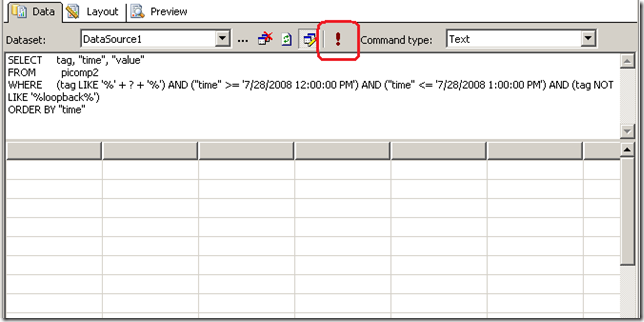
Look carefully at the WHERE clause in the above line. Instead of specifying %MYSERVER%, I have modified it to %?%. The question mark has special meaning. It means that you will be prompted to specify the string to be added to the SQL on the fly. Below I illustrate the sequence using three screenshots. The first screenshot shows the above SQL inside a visual studio report project. Clicking the exclamation mark will execute this SQL.
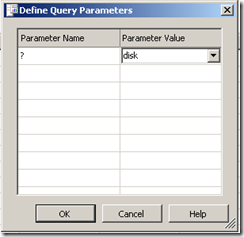
Immediately we get asked to fill out the parameter as shown below. (I have added the string "DISK")
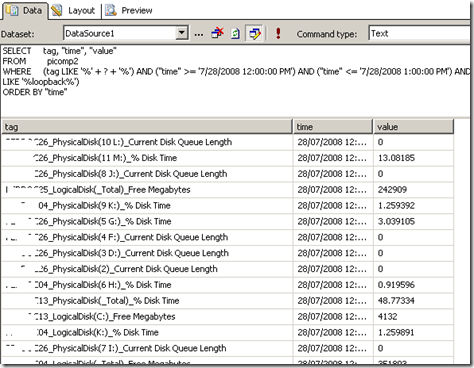
Clicking OK, and the SQL will now be executed against the datasource, with the matching results returned as shown below. Note the all data returned contains the word "disk" in the name. (I have scrubbed identifiable information to protect the innocent).
Reporting Services and SharePoint Integration
Now we get to the important bit. As mentioned earlier, SharePoint and SQL Reporting Services are now tightly integrated. I am not going to explain this integration in detail, but what I am going to show you is how a parameterised query like the example above is handled in SharePoint.
In short, if you want to display a Reporting Services report in SharePoint, you use a web part called the "SQL Server Reporting Services Report Viewer"
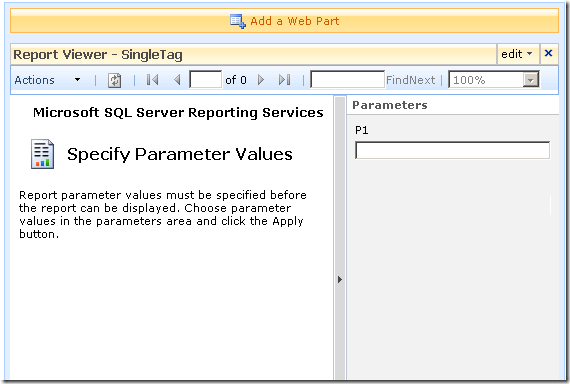
After dropping this webpart onto a SharePoint page, you pick the report to display, and if it happens to be a parameterised report, you see a screen that looks something like the following.
Notice anything interesting? The webpart recognises that the report requires a parameter and asks for you to enter it. As you will see in the second article, this is very useful indeed! But first let’s get reporting services talking to the PI historian.
Fun with OLEDB
So, I have described (albeit extremely briefly) enough information about PI and Reporting services. I mentioned earlier that PI is not a relational database, but a time series database. This didn’t stop OSISoft from writing an OLEDB provider 🙂
Thus it is possible to get SQL reporting services to query PI using SQL syntax. In fact the SQL example that I showed in the previous section was actually querying the PI historian.
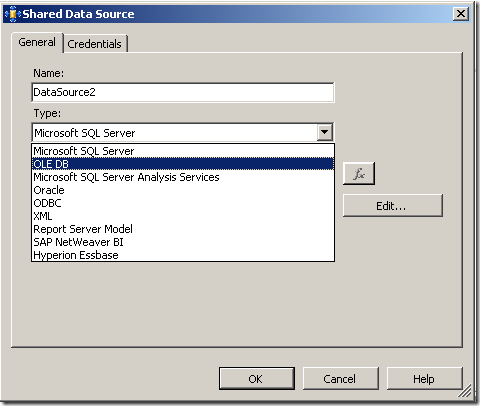
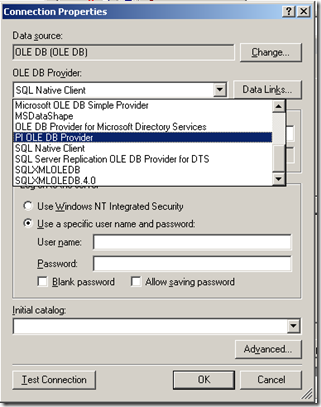
To get reporting services to be able to talk to PI, I need to create a report server Data Source as shown below. When selecting the data source type, I choose OLE DB from the list. The subsequent screen allows you to pick the specific OLEDB provider for PI from the list.
Now I won’t go into the complete details of completing the configuration of the PI OLE DB provider, as my point here is to demonstrate the core principle of using OLE DB to allow SQL Reporting Services to query a non-relational data store.
Once the data source had been configured and tested (see the test button in the above screenshot), I was able to then create my SQL query and then design a report layout. Here is the sample SQL again.
SELECT    "tag", "time", "value"
FROM      picomp2
WHERE     (tag LIKE '%' + ? + '%') AND ("time" >= '7/28/2008 12:00:00 PM') AND ("time" <= '7/28/2008 1:00:00 PM')
As I previously explained, this SQL statement contains a parameter, which is passed to the report when it is run, thereby providing the ability to generate a dynamic report.
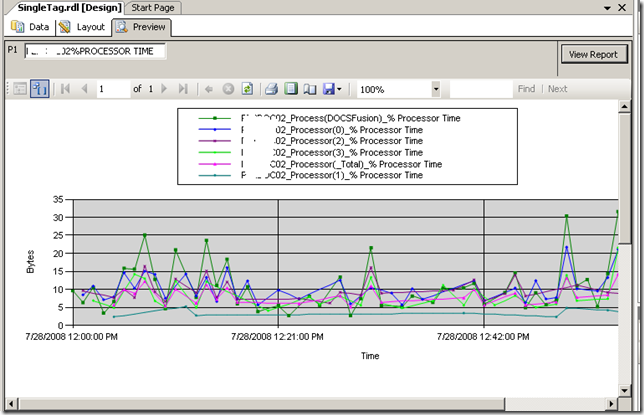
Using Visual Studio I created a new report and added a chart from the toolbox. Once again the purpose of this post is not to teach how to create a report layout, but below is a screenshot to illustrate the report layout being designed. You will see that I have previewed my design and it has displayed a textbox (top left) allowing the parameter to be entered for the report to be run. The report has pulled the relevant data from the PI historian and rendered it in a nice chart that I created.
Conclusion
Right! I think that’s about enough for now. To sum up this first post, we talked a little about my IT portal and the principle of "passive compliance". We examined OSISoft’s PI software and how it can be used to monitor your enterprise infrastructure. We then took a dive into SQL Reporting services and I illustrated how we can access PI historian data via OLE DB.
In the second and final post, I will introduce my IT Portal template in a brief overview, and will then demonstrate how I was able to integrate PI data into my IT portal to combine IT asset data with real-time performance metrics with no code 🙂
I hope that you found this post useful. Look out for the second half soon where this will all come together nicely
cheers
Paul

Hello,
Just thought I would make you aware of a PI discussion forum that has been launched to discuss anything regarding the PI system and its interfaces/applications.
It is http://www.rjksolutionsltd.co.uk/forum/
Look forwards to seeing all you PI guys posting on there.
Regards,
RJK.
Thanks for your post. Reporting services might be the answer for a project we’re involved with at the moment. There’s a lot of OSISoft’s rtWebParts, PI, SharePoint and SQL Server. We need to work around some limitations of rtWebParts and this might help.
I’ve been a big fan of PI’s IT monitor interfaces for ages now. I just saw a page on Microsoft’s MSDN site that said Microsoft were using PI in one of their datacenters for the same purpose. They described PI as their ‘blackbox flight recorder’ which is quite a good analogy.
Cheers, Jason.
http:
blog:
Thanks Jason
That is a terrific analogy actually Jason. Thanks very much for the reply
I’m glad you liked IT monitor, as the Netflow interface was my idea and I felt it was my baby anyway 🙂 In fact 3 of the people involved with Seven Sigma (our company) were those involved in the development of several IT Monitor interfaces…