Back to Cleverworkarounds mainpage
 

"Ain’t it cool?" - Integrating SharePoint and real-time performance data - Part 2

Hi again

This article is the second half of a pair of articles explaining how I integrated real-time performance data with an SharePoint based IT operational portal, designed around the principle of passive compliance with legislative or organisational controls.

In the first post, I introduced the PI product by OSIsoft, and explained how SQL Reporting services is able to generate reports from more than just SQL Server databases. I demonstrated how I created a report server report from performance data stored in the PI historian via an OLE DB provider for PI, and I also demonstrated how I was able to create a report that accepted a parameter, so that the output of the report could be customised.

I also showed how a SharePoint provides a facility to enter parameter data when using the report viewer web part.

We will now conclude this article by explaining a little about my passively compliant IT portal, and how I was able to enhance it with seamless integration with the real-time performance data stored in the PI historian.

Just to remind you, here is my conceptual diagram in "acoustic Visio" format

The IT portal

This is the really ultra brief explanation of the thinking that went into my IT portal

I spent a lot of time thinking about how critical IT information could be stored in SharePoint to achieve the goals of quick and easy access to information, make tasks like change/configuration management more transparent and efficient, as well as capture knowledge and documentation. I was influenced considerably by ISO17799 as it was called back then, especially in the area of asset management. I liked the use of the term "IT Assets" in ISO17799 and the strong emphasis on ownership and custodianship.

ISO defined asset as "any tangible or intangible thing that has value to an organization". It maintained that "…to achieve and maintain appropriate protection of organizational assets. All assets should be accounted for and have a nominated owner. Owners should be identified for all assets and the responsibility for the maintenance of appropriate controls should be assigned. The implementation of specific controls may be delegated by the owner as appropriate but the owner remains responsible for the proper protection of the assets."

That idea of delegation is that an owner of an asset can delegate the day-to-day management of that asset to a custodian, but the owner still bears ultimate responsibility.

So I developed a portal around this idea, but soon was hit by some constraints due to the broad ISO definition of an asset. Since assets have interdependencies, geeks have a tendency to over-complicate things and product a messy web of interdependencies. After some trial and error, as well as some soul searching I was able to come up with a 3 tier model that worked.

I changed the use of the word "asset", and split it into three broad asset types.

  • Devices (eg Server, SAN, Switch, Router, etc)
  • IT Services (eg Messaging, Databases, IP Network, etc)
  • Information Assets (eg Intranet, Timesheets,
image

The main thing to note about this model is to explain the different between an IT Service and an Information Asset. The distinction is in the area of ownership. In the case of an "Information Asset", the ownership of that asset is not IT. IT are a service provider, and by definition the IT view of the world is different to the rest of the organisation. An "IT Service" on the other hand, is always owned by IT and it is the IT services that underpin information assets.

So there is a hierarchical relationship there. You can’t have an information asset without an IT service providing it. Accountabilities are clear also. IT own the service, but are not responsible for the information asset itself - that’s for other areas of the organisation. (an Information Asset can also depend on other information assets as well as many IT services.

While this may sound so obvious that its not worth writing, my experience is that IT department often view information assets and the services providing those assets as one and the same thing.

Devices and Services

So, as an IT department, we provide a variety of services to the organisation. We provide them with an IP network, potentially a voice over IP system, a database subsystem, a backup and recovery service, etc.

It is fairly obvious that each IT service consists of a combination of IT devices (and often other IT services). an IP network is an obvious one and a basic example. The devices that underpin the "IP Network" service are routers, switches and wireless access points.

For devices we need to store information like

  • Serial Number
  • Warranty Details
  • Physical Location
  • Vendor information
  • Passwords
  • Device Type
  • IP Address
  • Change/Configuration Management history
  • IT Services that depend on this device (there is usually more than 1)

For services, we need to store information like

  • Service Owner
  • Service Custodian
  • Service Level Agreement (uptime guarantees, etc)
  • Change/Configuration Management history
  • IT Devices that underpin this service (there is usually more than 1)
  • Dependency relationships with other IT services
  • Information Assets that depend on this IT service

Keen eyed ITIL practitioners will realise that all I am describing here is a SharePoint based CMDB. I have a site template, content types, lists, event handlers and workflows that allow the above information to be managed in SharePoint. Below is three snippets showing sections of the portal, drilling down into the device view by location (click to expand), before showing the actual information about the server "DM01"

image image

image

Now the above screen is the one that I am interested in. You may also notice that the page above is a system generated page, based on the list called "IT Devices". I want to add real-time performance data to this screen, so that as well as being able to see asset information about a device, I also want to see its recent performance.

Modifying a system page

I talked about making modifications to system pages in detail in part 3 of my branding using Javascript series. Essentially, a system page is an automatically generated ASPX page that SharePoint creates. Think about what happens each time you add a column to a list or library. The NewForm.aspx, Editform.Aspx and Dispform.aspx are modified as they have to be rebuild to display the new or modified column.

SharePoint makes it a little tricky to edit these pages on account of custom modifications running the risk of breaking things. But as I described in the branding series, using the ToolPaneView hack does the job for us in a safe manner.

So using this hack, I was able to add a report viewer web part to the Dispform.aspx of the "IT devices" list as shown below.

image image

imageimage

Finally, we have our report viewer webpart, linked to our report that accesses PI historian data. As you can see below, the report that I created actually is expecting two parameters to be supplied. These parameters will be used to retrieve specific performance data and turn it into a chart.

image

Web Part Connection Magic

Now as it stands, the report is pretty much useless to us in the sense that we have to enter parameters to it manually, to get it to actually present us the information that we want. But on the same page as this report is a bunch of interesting information about a particular device, such as its name, IP Address, location and description. Wouldn’t it be great if we could somehow pass the device name (or some other device information) to the report web part automatically.

That way, each time you opened up a device entry, the report would retrieve performance information for the device currently being viewed. That would be very, very cool.

Fortunately for us it can be easily done. The report services web part, like many other web parts is connectable. This means that it can accept information from other web parts. This means that it is possible to have the parameters automatically passed to the report! 

Wohoo!

So here is how I am going to do this. I am going to add two new columns to my device list. Each column will be the parameter passed to the report. This way, I can tailor the report being generated on a device by device basis. For example, for a SAN device I might want to report on disk I/O, but a server I might want CPU. If I store the parameter as a column, the report will be able to retrieve whatever performance data I need.

Below shows the device list with the additional two columns added. the columns are called TAGPARAM1 and TAGPARAM2. The next screen below, shows the values I have entered for each column against the device DM01. These values will be passed to the report server report and used to find matching performance data.

image image

So the next question becomes, how do I now transparently pass these two parameters to the report? We now have the report and the parameters on the same page, but no obvious means to pass the value of TagParam1 and TagParam2 to the report viewer web part.

The answer my friends, is to use a filter web part!

Using the toolpane view hack, we once again edit the view item page for the Device List. We now need to add two additional web parts (because we have two parameters). Below is the web part to add.

image

The result should be a screen looking like the figure below

image

Filter web parts are not visible when a page is rendered in the browser. They are instead used to pass data between other web parts. There are various filter web parts that work in different ways. The Page Field filter is capable of passing the value of any column to another web part.

Confused? Check out how I use this web part below…

The screen above shows that the two Page Field filters web parts are not configured. They are prompting you to open the tool pane and configure them. Below is the configuration pane for the page field filter. Can you see how it has enumerated all of the columns for the "IT device" list? In the second and third screen we have chosen TagParam1 for the first page filter and TagParam2 for the second page filter web part.

image image image

Now take a look at the page in edit mode. The page filters now change display to say that they are not connected. All we have done so far is tell the web parts which columns to grab the parameter values from

image

Almost Home - Connecting the filters

So now we need to connect each Page Field filter web part to the report viewer web part. This will have the effect of passing to the report viewer web part, the value of TagParam1 and TagParam2. Since these values change from device to device, the report will display unique data for each device.

To to connect each page filter web part you click the edit dropdown for each page filter. From the list of choices, choose "Connections", and it will expand out to the choice of "Send Filter Values To". If you click on this, you will be promoted to send the filter values to the report viewer web part on the page. Since in my example, the report viewer web part requires two parameters, you will be asked to choose which of the two parameters to send the value to.

image image

Repeat this step for both page filter web parts and something amazing happens, we see a performance report on the devices page!! The filter has passed the values of TagParam1 and tagParam2 to the report and it has retrieved the matching data!

image

Let’s now save this page and view it in all of its glory! Sweet eh!

image 

Conclusion (and Touchups)

So let’s step back and look at what we have achieved. We can visit our IT Operations portal, open the devices list and immediately view real-time performance statistics for that device. Since I am using a PI historian, the performance data could have been collected via SNMP, netflow, ping, WMI, Performance Monitor counters, a script or many, many methods. But we do not need to worry about that, we just ask PI for the data that we want and display it using reporting services.

Because the parameters are stored as additional metadata with each device, you have complete control over the data being presented back to SharePoint. You might decide that servers should always return CPU stats, but a storage area network return disk I/O stats. It is all controllable just by the values you enter into the columns being used as report parameters.

The only additional thing that I did was to use my CleverWorkArounds Hide Field Web Part, to subsequently hide the TagParam1 and TagParam2 fields from display, so that when IT staff are looking at the integrated asset and performance data, the ‘behind the scenes’ glue is hidden from them.

So looking at this from a IT portal/compliance point of view, we now have an integrated platform where we can:

  • View device asset information (serial number, purchase date, warranty, physical location)
  • View IT Service information (owners, custodians and SLA’s)
  • View Information Asset information (owners, custodians and SLA’s)
  • Understand the relationships between devices, services and information assets
  • Access standards, procedures and work instructions pertaining to devices, services and information assets
  • Manage change and configuration management for devices, services and information assets
  • Quickly and easily view detailed, real time performance statistics of devices

All in all, not a bad afternoons work really! And not one line of code!

As i said way back at the start of the first article, this started out as a quick idea for a demo and it seems to have a heck of a lot of potential. Of course, I used PI but there is no reason why you can’t use similar techniques in your own IT portals to integrate your operational and performance data into the one place.

I hope that you enjoyed this article and I look forward to feedback.

<Blatant Plug>Want an IT Portal built in passive compliance? Then let’s talk!</Blatant Plug>

cheers

Paul Culmsee


OSISoft addendum

Now someone at OSISoft at some point will read this article and wonder why I didn’t write about RTWebparts. Essentially PI has some web parts that can be used to display historian data in SharePoint. There were two reasons why I did not mention them.

  1. To use RTWebparts you have to install a lot of PI components onto your web front end servers. Nothing wrong with that, but with Report Services, those components only need to go onto the report server. For my circumstances and what I had to demonstrate, this was sufficient.
  2. This post was actually not about OSISoft or PI per se. It was used to demonstrate how it is possible to use SharePoint to integrate performance and operational information into one integrated location. In the event that you have PI in your enterprise and want to leverage it with SharePoint, I suggest you contact me about it because we do happen to be very good at it :-)


No Tags


"Ain’t it cool?" - Integrating SharePoint and real-time performance data - Part 1

Hi

This is one of those nerdy posts in the category of "look at me! look at me! look at what I did, isn’t it cool?". Normally application developers write posts like this, demonstrating some cool bit of code they are really proud of. Being only a part-time developer and more of a security/governance/compliance kind of guy, my "aint it cool" post is a little different.

So if you are a non developer and you are already tempted to skip this one, please reconsider. If you are a CIO, IT manager, Infrastructure manager or are simply into ITIL, COBiT or compliance around IT operations in general, this post may have something for you. It offers something for knowledge managers too. Additionally it gives you a teensy tiny glimpse into my own personal manifesto of how you can integrate different types of data to achieve the sort of IT operational excellence that is a step above where you may be now.

Additionally, if you are a Cisco nerd or an infrastructure person who has experience with monitoring, you will also find something potentially useful here.

In this post, I am going to show you how I leveraged three key technologies, along with a dash of best practice methodology to create an IT Portal that I think is cool.

The Premise - "Passive Compliance"

In my career I have filled various IT roles and drunk the kool-aid of most of the vendors, technologies, methodologies and practices. Nowadays I am a product of all of these influences, leaving me slightly bitter and twisted, somewhat of a security nerd, but at the same time fairly pragmatic and always mindful of working to business goals and strategy.

One or the major influences to my current view of the world, was a role working for OSI Software from 2000-2004, via a former subsidiary company called WiredCity. OSISoft develop products in the process control space, and their core product is a data historian called PI. At WiredCity, we took this product out of the process control market and right into the IT enterprise and OSISoft now market this product as "IT Monitor". I’ll talk about PI/IT monitor in detail in a moment, but humour me and just accept my word that it is a hellishly fast number crunching database for storing lots of juicy performance data.

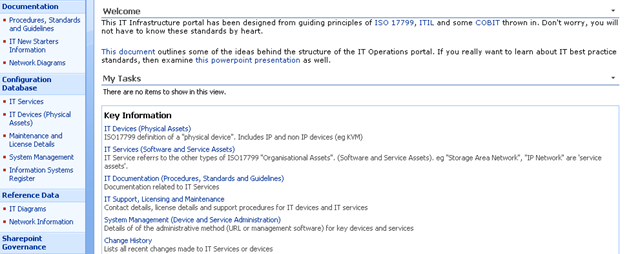
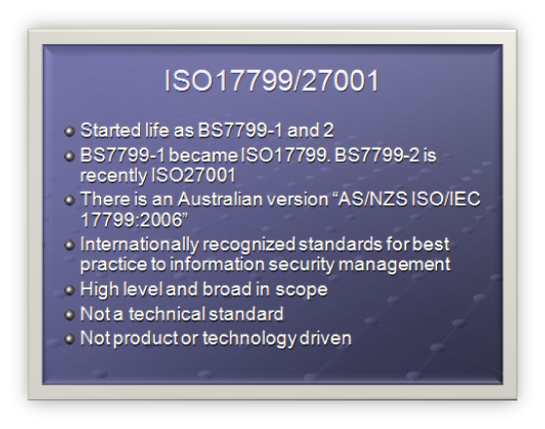
An addition I like to read all the various best practice frameworks and methodologies and I write about them a fair bit. As a result of this interest, I have a SharePoint IT portal template that I have developed over the last couple of years, designed around the guiding principle of passive compliance. That is, by utilising the portal for IT various operational tasks, structured in a certain way, you implicitly address some COBiT/ISO27001 controls as well as leverage ITIL principles. I designed it in such a way that an auditor could take a look at it and it would demonstrate the assurance around IT controls for operational system support. It also had the added benefit of being a powerful addition to disaster recovery strategy. (In the second article, to be published soon, I will describe my IT portal in more detail).

Finally, I have SQL Reporting Services integrated with SharePoint, used to present enterprise data from various databases into the IT Portal - also as part of the principle of passive compliance via business intelligence.

Recently, I was called in to help conduct a demonstration of the aforementioned PI software, so I decided to add PI functionality to my existing "passive compliance" IT portal to integrate asset and control data (like change/configuration management) along with real-time performance data. All in all I was very pleased with the outcome as it was done in a day with pretty impressive effect. I was able to do this with minimal coding, utilising various features of all three of the above applications with a few other components and pretty much wrote no code at all.

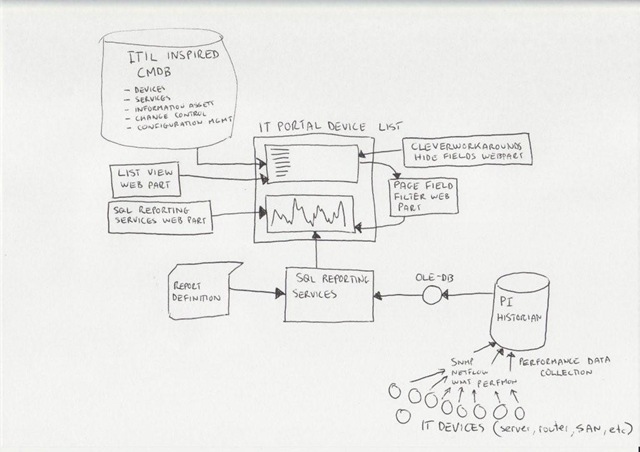
Below I have built a conceptual diagram of the solution. Unfortunately I don’t have Visio installed, but I found a great freeware alternative ;-)

Image0003

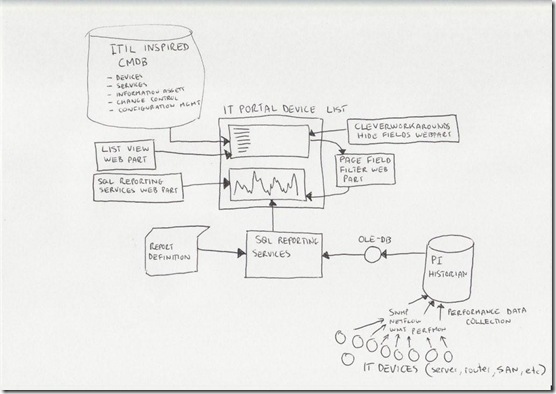
I know, there is a lot to take in here (click to enlarge), but if you look in the center of the diagram, you will see a mock up of a SharePoint display. All of the other components drawn around it combine to produce that display. I’ll now talk about the main combination, PI and SQL Reporting Services.

A slice of PI

Okay so let’s explain PI because I think most people have a handle on SharePoint :-).

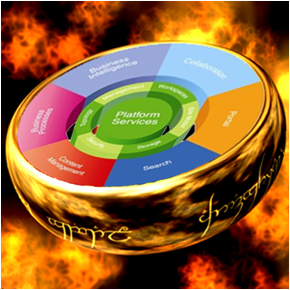
To the right is the terminator looking at data from a PI historian showing power flow in California. So this product is not a lightweight at all. It’s heritage lies in this sort of critical industrial monitoring.

Just to get the disclaimers out of the way, I do not work for OSISoft anymore nor are they even aware of this post. Just so hard-core geeks don’t flame me and call me a weenie, let me just say that I love RRDTool and SmokePing and prefer Zabbix over Nagios. Does that make me cool enough to make comment on this topic now? :-)   

Like RRDTool, PI is a data historian, designed and optimised for time-series data.

"Data historian? Is that like a database of some kind?", you may ask. The answer is yes, but its not a relational database like SQL Server or Oracle. Instead, it is a "real-time, time series" data store. The English translation of that definition, is that PI is extremely efficient at storing time based performance data.

"So what, you can store that in SQL Server, mySQL or Oracle", I hear you say. Yes you most certainly can. But PI was designed from the ground up for this kind of data, whereas relational databases are not. As a result, PI is blisteringly fast and efficient. Pulling say, 3 months of data that was collected at 15 second intervals would literally take seconds to do, with no loss of fidelity, even going back months.

As an example, let’s say you needed to monitor CPU usage of a critical server. PI could collect this data periodically, save it into the historian for later view/review/reporting or analysis. Getting data into the historian can be performed a number of ways. OSISoft have written ‘interfaces’ to allow collection of data from sources such as SNMP, WMI, TCP-Response, Windows Performance Monitor counters, Netflow and many others.

The main point is that once the data is inside the historian, it really doesn’t matter whether the data was collected via SNMP, Performance Monitor, a custom script, etc. All historian data can now be viewed, compared, analysed and reported via a variety of tools in a consistent fashion.

SQL Reporting Services

For those of you not aware, Reporting Services has been part of SQL Server since SQL 2000 and allows for fairly easy generation of reports out of SQL databases. More recently, Microsoft updated SQL Server 2005 with tight integration with SharePoint. Now when creating a report server report, it is "published" to SharePoint in a similar manner to the publishing of InfoPath forms.

Creating reports is performed via two ways, but I am only going to discuss the Visual Studio method. Using Visual Studio, you are able to design a tailored report, consisting of tables and charts. An example of a SQL Reporting Services Report in visual studio is below. (from MSDN)


The interesting thing about SQL Reporting services is that it can pull data from data sources other than SQL Server databases. Data sources include Oracle, Web Services, ODBC and OLE-DB. Depending on your data source, reports can be parameterised (did I just make up a new word? :-) ). This is particularly important to SharePoint as you will soon see. It essentially means that you can feed your report values that customise the output of that report. In doing so, reports can be written and published once, yet be flexible in the sort of data that is returned.

Below is a basic example:

Here is a basic SQL statement that retrieves three fields from a data table called "picomp2". Those fields are "Tag", "Time" and "Value". This example selects values only where "Time" is between 12-1pm on July 28th and where "tag" contains the string "MYSERVER"

SELECT    "tag", "time", "value"
FROM      picomp2
WHERE     (tag LIKE ‘%MYSERVER%’) AND ("time" >= ‘7/28/2008 12:00:00 PM’) AND ("time" <= ‘7/28/2008 1:00:00 PM’)

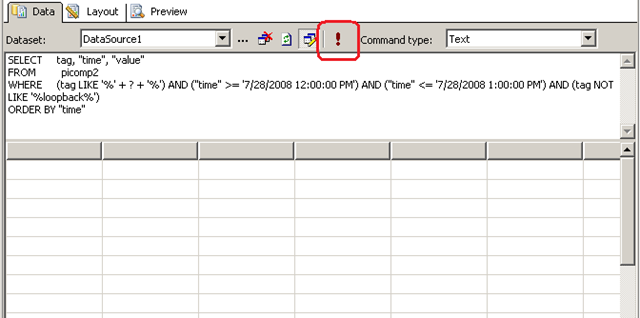
Now what if we wanted to make the value for TAG flexible? So instead of "MYSERVER", use the string "DISK" or "PROCESSOR". Fortunately for most data sources, SQL Reporting Services allows you to pass parameters into the SQL. Thus, consider this modified version of the above SQL statement.

SELECT    "tag", "time", "value"
FROM      picomp2
WHERE     (tag LIKE ‘%’ + ? + ‘%’) AND ("time" >= ‘7/28/2008 12:00:00 PM’) AND ("time" <= ‘7/28/2008 1:00:00 PM’) 

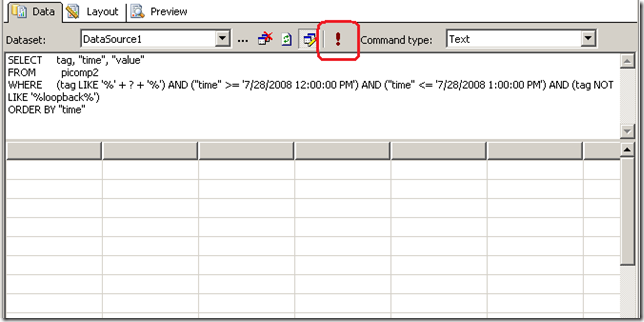
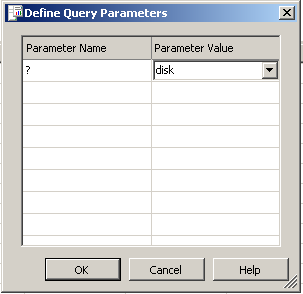
Look carefully at the WHERE clause in the above line. Instead of specifying %MYSERVER%, I have modified it to %?%. The question mark has special meaning. It means that you will be prompted to specify the string to be added to the SQL on the fly. Below I illustrate the sequence using three screenshots. The first screenshot shows the above SQL inside a visual studio report project. Clicking the exclamation mark will execute this SQL.

image

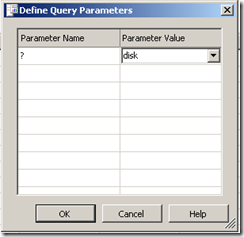
Immediately we get asked to fill out the parameter as shown below. (I have added the string "DISK")

image

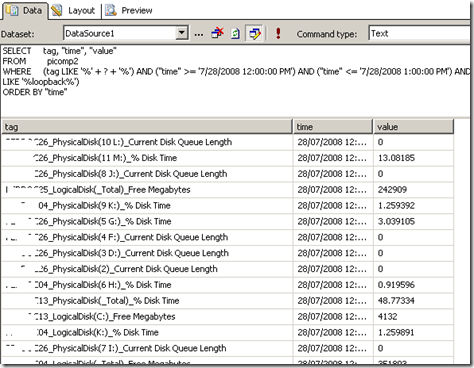
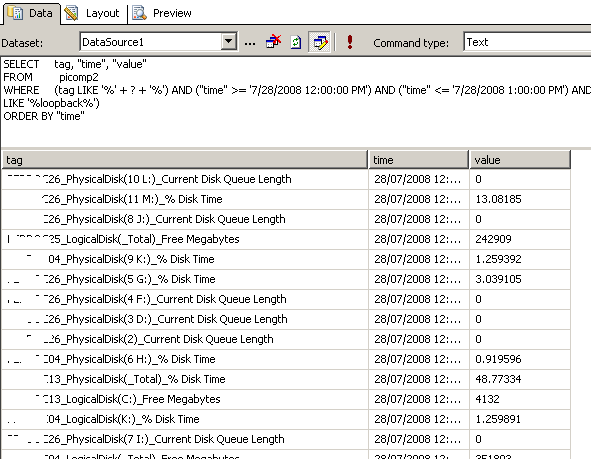
Clicking OK, and the SQL will now be executed against the datasource, with the matching results returned as shown below. Note the all data returned contains the word "disk" in the name. (I have scrubbed identifiable information to protect the innocent).

image

Reporting Services and SharePoint Integration

Now we get to the important bit. As mentioned earlier, SharePoint and SQL Reporting Services are now tightly integrated. I am not going to explain this integration in detail, but what I am going to show you is how a parameterised query like the example above is handled in SharePoint.

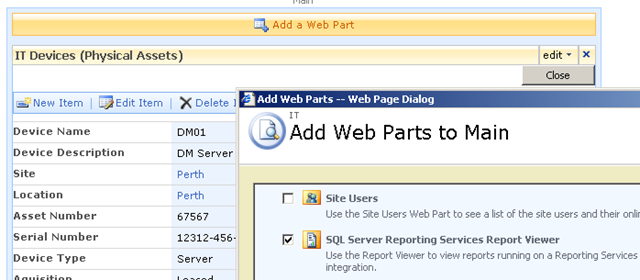
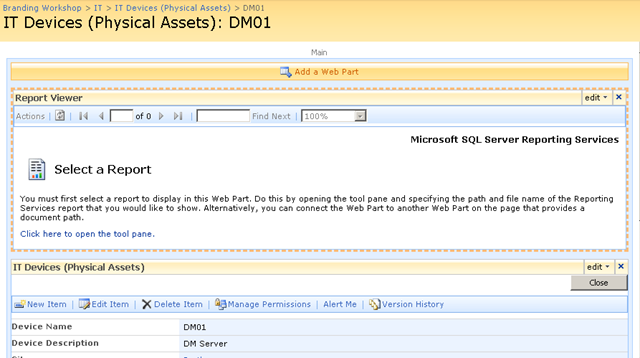
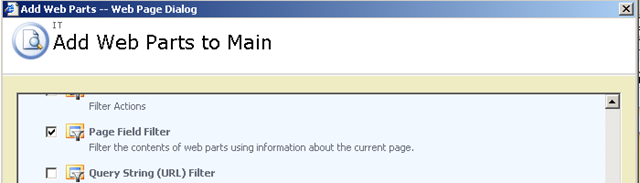
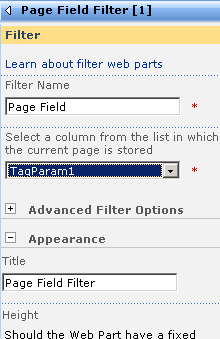
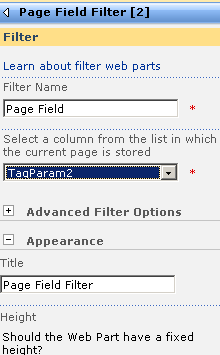
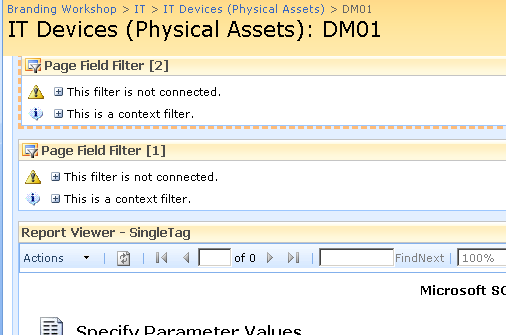
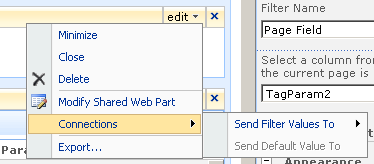
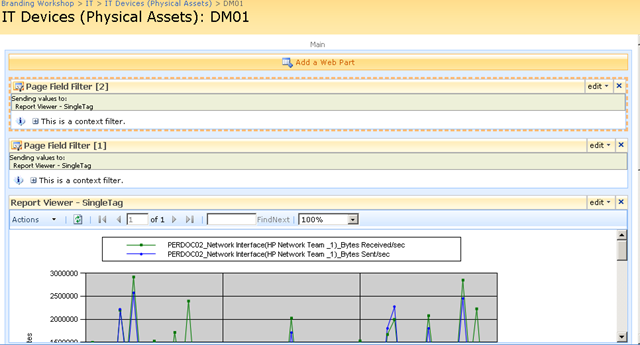
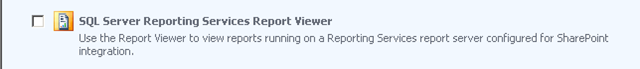
In short, if you want to display a Reporting Services report in SharePoint, you use a web part called the "SQL Server Reporting Services Report Viewer"

image

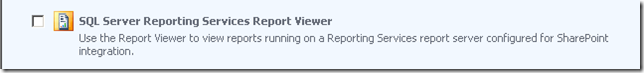
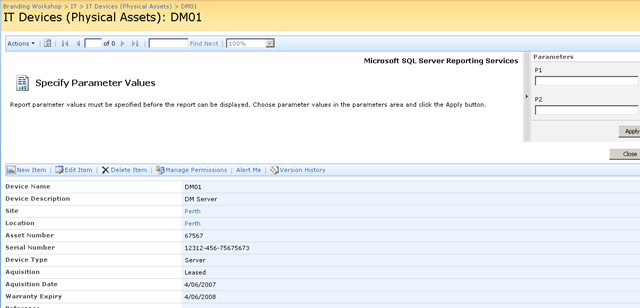
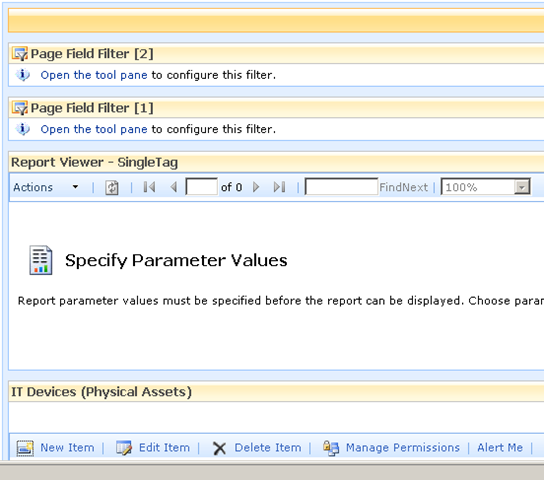
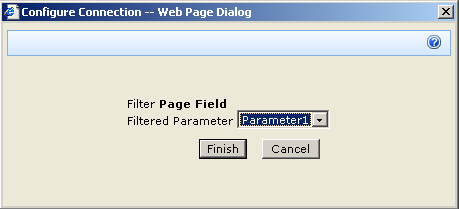
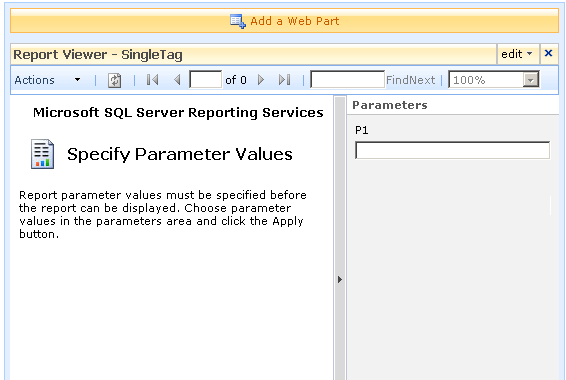
After dropping this webpart onto a SharePoint page, you pick the report to display, and if it happens to be a parameterised report, you see a screen that looks something like the following.

image

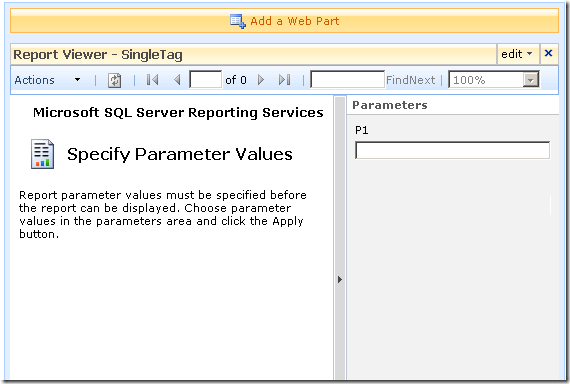
Notice anything interesting? The webpart recognises that the report requires a parameter and asks for you to enter it. As you will see in the second article, this is very useful indeed! But first let’s get reporting services talking to the PI historian.

Fun with OLEDB

So, I have described (albeit extremely briefly) enough information about PI and Reporting services. I mentioned earlier that PI is not a relational database, but a time series database. This didn’t stop OSISoft from writing an OLEDB provider :-)

Thus it is possible to get SQL reporting services to query PI using SQL syntax. In fact the SQL example that I showed in the previous section was actually querying the PI historian.

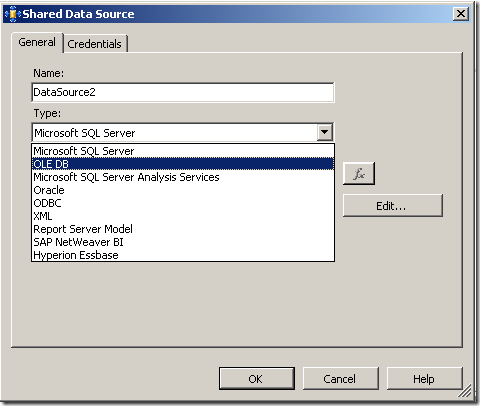
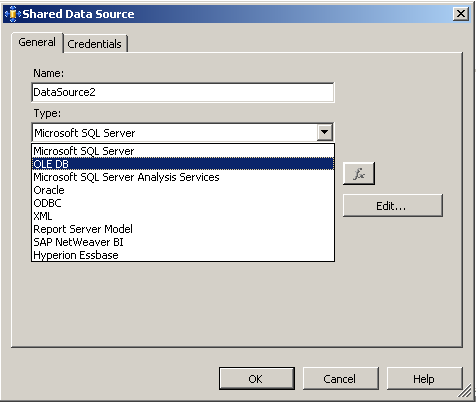
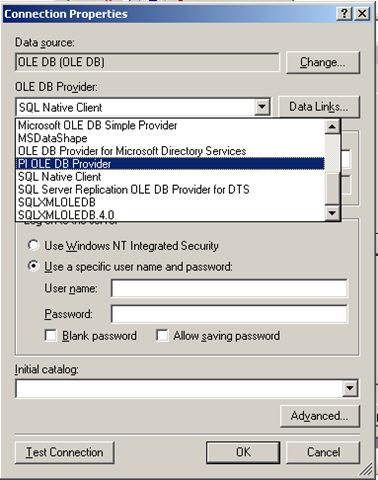
To get reporting services to be able to talk to PI, I need to create a report server Data Source as shown below. When selecting the data source type, I choose OLE DB from the list. The subsequent screen allows you to pick the specific OLEDB provider for PI from the list.

image image

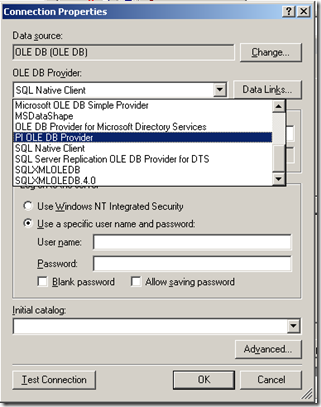
Now I won’t go into the complete details of completing the configuration of the PI OLE DB provider, as my point here is to demonstrate the core principle of using OLE DB to allow SQL Reporting Services to query a non-relational data store.

Once the data source had been configured and tested (see the test button in the above screenshot), I was able to then create my SQL query and then design a report layout. Here is the sample SQL again.

SELECT    "tag", "time", "value"
FROM      picomp2
WHERE     (tag LIKE ‘%’ + ? + ‘%’) AND ("time" >= ‘7/28/2008 12:00:00 PM’) AND ("time" <= ‘7/28/2008 1:00:00 PM’) 

As I previously explained, this SQL statement contains a parameter, which is passed to the report when it is run, thereby providing the ability to generate a dynamic report.

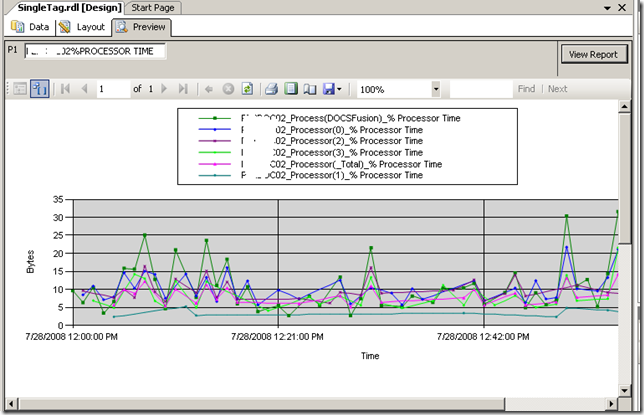
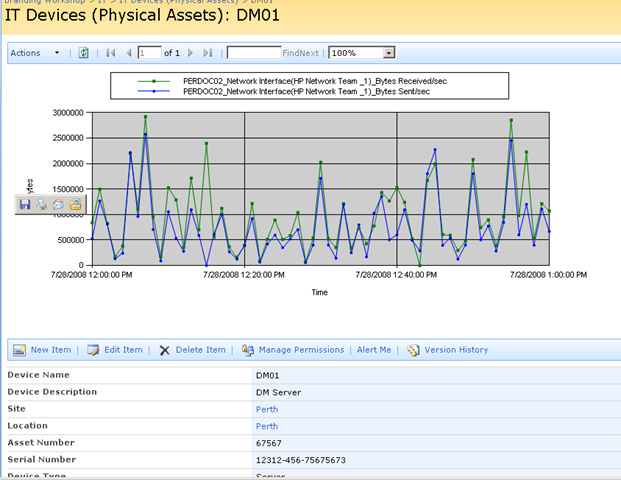
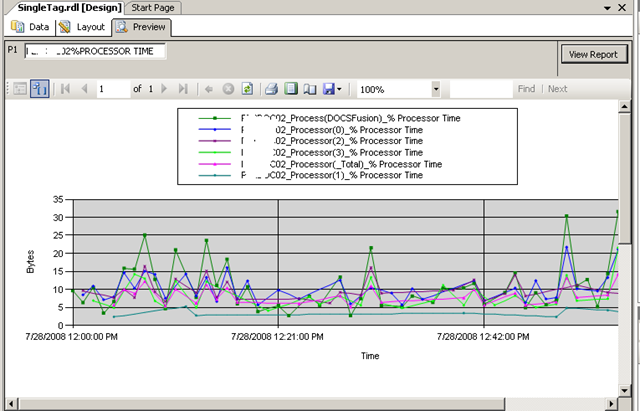
Using Visual Studio I created a new report and added a chart from the toolbox. Once again the purpose of this post is not to teach how to create a report layout, but below is a screenshot to illustrate the report layout being designed. You will see that I have previewed my design and it has displayed a textbox (top left) allowing the parameter to be entered for the report to be run. The report has pulled the relevant data from the PI historian and rendered it in a nice chart that I created.

image

Conclusion

Right! I think that’s about enough for now. To sum up this first post, we talked a little about my IT portal and the principle of "passive compliance". We examined OSISoft’s PI software and how it can be used to monitor your enterprise infrastructure. We then took a dive into SQL Reporting services and I illustrated how we can access PI historian data via OLE DB.

In the second and final post, I will introduce my IT Portal template in a brief overview, and will then demonstrate how I was able to integrate PI data into my IT portal to combine IT asset data with real-time performance metrics with no code :-)

I hope that you found this post useful. Look out for the second half soon where this will all come together nicely

cheers

Paul


No Tags


Why do SharePoint Projects Fail? - Part 8

Hi

Well, here we are at part 8 in a series of posts dedicated to the topic of SharePoint project failure. Surely after 7 posts, you would think that we are exhausting the various factors that can have a negative influence on time, budget and SharePoint deliverables? Alas no! My urge to peel back this onion continues unabated and thus I present one final post in this series.

Now if I had my time again, I would definitely re-order these posts, because this topic area is back in the realm of project management. But not to worry. I’ll probably do a ‘reloaded’ version of this series at some point in the future or make an ebook that is more detailed and more coherently written, along with contributions from friends.

In the remote chance that you are hitting this article first up, it is actually the last of a long series written over the last couple of months (well, last for now anyway). We started this series with an examination of the pioneering work by Horst Rittell in the 1970’s and subsequently examined some of the notable historical references to wicked problems in IT. From there, we turned our attention to SharePoint specifically and why it, as a product, can be a wicked problem. We looked at the product from viewpoints, specifically, project managers, IT infrastructure architects and application developers.

In the last article, we once again drifted away from SharePoint directly and looked at senior management and project sponsors contribution. Almost by definition, when looking at the senior management level, it makes no sense to be product specific, since at this level it is always about business strategy.

In this post, I’d like to examine when best practice frameworks, the intent of which is to reduce risk of project failure, actually have the opposite effect. We will look at why this is the case in some detail.

CleverWorkarounds tequila shot rating..

 image image image image  For readers with a passing interest in best practice frameworks and project management.

imageimageimage For nerds who swear they will never leave the "tech stuff."

Continue reading “Why do SharePoint Projects Fail? - Part 8″

No Tags


Compliance is about to get worse…

I think SharePoint is an excellent platform for quality improvement, PMO and compliance efforts. But this is a non SharePoint oriented post. I’m sick of writing nerdy stuff at the moment.

In 2001, the supposedly blue chip US multinational called Enron filed for bankruptcy. For you younglings who were still at school, this made pretty big news around the world. Many of the senior executives are still in jail for fraud related offenses. the whole sorry tale is one of greed, corruption, deceit, insider trading, huge theft of workers’ entitlements and massive job losses. As part of the collateral damage, Enron’s auditing firm, “Arthur Anderson” was also obliterated as its reputation dissolved quicker than Paris Hilton’s credibility.

google “enron scandal” - it’s interesting reading

Sarbanes-Oxley (real brief version)

Anyway, one of the things that came out of this and other scandals like Worldcom, was the Sarbanes-Oxley act. Its intent was to:

Protect investors by improving the accuracy and reliability of corporate disclosures made pursuant to the securities laws, and for other purposes.

It did this by creating new standards for corporate accountability, and significantly beefed up penalties for acts of wrongdoing. Boards and executives are now personally accountable for the accuracy of financial statements. There are additional financial reporting responsibilities, with particular focus on the verifiable application of internal controls and procedures designed to ensure the validity of their financial records.

Now executives tend to like spreading the love (risk) around, and if they are going to go down, they like to take others with them. So IT professionals also have to do their bit for the common good. This is because the financial reporting processes of organisations heavily utilise IT technology. As a result, IT controls that relate to financial risk are fair game.

So how to account for IT controls?

COBiT

COBiT is not the only IT control methodology used for SOX compliance, but it’s the only one I am familiar with :-) COBiT (Control Objectives of Information and Related Technology) is commonly used as the framework to cover all your IT controls. I won’t get into detail here, as COBiT is a big subject in itself, and I have some information here already.

SOX Criticisms

Was SOX an over-reaction to isolated indecent’s of large scale fraud? It is clear that some believe this to be the case. “Compliance cost is too onerous” is very commonly cited, particularly with smaller affected firms. Most scarily for me, is seeing the term ‘SOX’ being used as a sales tool for products that at best, have little relevance to what SOX compliance is really about. The same criticism can be levelled against service companies as well, who are happy to bag Microsoft’s amateurish use of FUD, yet use disturbingly similar methods to sell products and services that have questionable relevance.

When researching my training material last year, I came across this nugget of information that gave an indication of the level of frustration that SOX has caused.

A global study from European accountants Mazars, found that close to 20% of EU companies are planning to de-list from the US market to avoid complying and more than half feel the costs outweigh the benefits 

But I then found this interesting snippet.

However this has the potential to impact on the cost of credit for such companies as warned in July 2006 by Moodys. “The cost of capital for public companies in countries that choose not to implement US Sarbanes-Oxley (SOX) type corporate governance rules may soon increase to reflect the additional risk premium resulting from companies and their auditors concealing the true level of audit risk” 

So now we come to the point of this post. What did they say above? “Cost of credit”? So Moodys implies that SOX compliance offers a level of assurance to suppliers of capital.

Six Years Later

I liked Moodys’ quote in the previous section. Fast forward to the present and the word “credit crunch” is on the news quite a lot. So is it fair to rate the effectiveness of SOX compliance based on the current turmoil in financial markets?

To answer that question, we have to look at the current problems that have led to the current financial crisis affecting world markets.

Here is a pretty good layman’s summary that explains the sub-prime issue and the problems with stagnant or falling property values. However we need to delve a little deeper here. The New York Times has a great article that goes into the necessary detail but it is large, and I’ll try and paraphrase it as briefly as I can.

In the past decade, there has been an explosion in complex derivative instruments, such as collateralized debt obligations and credit default swaps, which were intended primarily to transfer risk.

These products are virtually hidden from investors, analysts and regulators, even though they have emerged as one of Wall Street’s most outsized profit engines. They don’t trade openly on public exchanges, and financial services firms disclose few details about them 

Among the topics they discussed were investment vehicles that allowed Citigroup and other banks to keep billions of dollars in potential liabilities off of their balance sheets — and away from the scrutiny of investors and analysts. 

Now what was the intent of SOX again? “To protect investors by improving the accuracy and reliability of corporate disclosures made pursuant to the securities laws, and for other purposes”. What do we see above? “potential liabilities off the balance sheet” … hmm

But there’s more..

Credit rating agencies, paid by banks to grade some of the new products, slapped high ratings on many of them, despite having only a loose familiarity with the quality of the assets behind these instruments.

Still others say the primary reason the Fed moved so quickly was to divert an even bigger crisis: a meltdown in an arcane yet huge market known as credit default swaps. Like C.D.O.’s, which few outside of Wall Street had ever heard about before last summer, the credit default swaps market is conducted entirely behind the scenes and is not regulated.

Ratings agencies have similarly been under fire ever since the credit crisis began to unfold, and new regulations may force them to distance themselves from the investment banks whose products they were paid to rate.

If you research into the fate of Arthur Anderson, they were screwed by a sudden and fatal loss of reputation as a result of their association and conflict of interest issues in relation to Enron. Disturbingly, the last quote above criticising ratings agencies reminds me very much of the conflict of interest criticisms levelled at audit firms like Arthur Anderson.

Crystal Ball Time

Since the practices quoted above are not necessarily illegal, and it is too early to determine whether the SOX laws will be used in a punitive sense to institutions caught up in the current crisis. I’m not a lawyer and as a result, my opinion here is naively uninformed. But like the Enron/Worldcom scandals, regulatory authorities and other interested parties will rightfully ask questions about risk management, and therefore the effectiveness of the controls for SOX compliant organisations.

This current crisis makes previous scandals pale into insignificance. A news site that I frequent reports that US investment bank Goldman Sachs  suggests that credit losses will amount to 1.2 trillion US dollars. That is a freakin’ *insane* amount of money and many people affected do not even realise it yet until they see their next pension/superannuation statement.

Consider that the world population is some 6.6 billion people. The above loss is therefore 180 US dollars per person on the planet! … Mind boggling isn’t it.

Notwithstanding the directly affected people who are defaulting on their mortgage, getting margin called, etc. Many, many people will be royally pissed. Politicians will react to this by forming committees to look at how to prevent this from happening again. SOX will be revised, or new regulations will be developed. More checks and balances, more compliance overheads, more disclosure.

Thus, more accountants, more lawyers, more business advisers, more IT security professionals, and of course, smelling a new FUD angle, more snake oil salesmen selling irrelevent products and services.

If companies think that their compliance costs are high now, just wait. I think it’s going to get a lot worse.

No Tags


SharePoint Branding Part 7 -The ‘governance’ of it all..

Well, here we are! After delving into dark arts where everybody but metrosexual web designers fear to tread (HTML and CSS), we then delved into the areas that metrosexual web designers truly fear to tread (packaging, deployment and even some c# code!). Finally, we get to the area where everybody is interested until it happens to get in their way! (Ooh, I am a cynical old sod tonight).

That is Governance!

Continue reading “SharePoint Branding Part 7 -The ‘governance’ of it all..”

No Tags


IT Governance Standards: COBIT, ISO17799/27001, ITIL and PMBOK – Part 4

Tags: COBiT, Governance, ISO17799/27001, ITIL @ 12:57 am

The content of this blog is essentially material I compiled for training sessions that I ran last year. It was originally PowerPoint, but I hope that this blog version is useful. Some of the legislative stuff is probably now out of date, and it was for an Australian audience – moral of the story is to do your own research.

For part 1 of this presentation, view this post, part 2 this post and part 3 here.

ISO17799/27001

  • Started life as BS7799-1 and 2
  • BS7799-1 became ISO17799. BS7799-2 is recently ISO27001
  • There is an Australian version "AS/NZS ISO/IEC 17799:2006"
  • Internationally recognized standards for best practice to information security management
  • High level and broad in scope
  • Not a technical standard
  • Not product or technology driven

ISO 17799 is a direct descendant of part of the British Standard Institute (BSI) Information Security Management standard BS 7799. The BSI (www.bsi-global.com) has long been proactive in the evolving arena of Information Security.

The BS 7799 standard consists of:

  • Part 1: Information Technology-Code of practice for information security management
  • Part 2: Information security management systems-Specification with guidance for use.

BS7799 was revised several times, and by 2000 information security had become headline news and a concern to computer users worldwide. Demand grew for an internationally recognized information security standard under the aegis of an internationally recognized body, such as the ISO. This demand led to the "fast tracking" of BS 7799 Part 1 by the BSI, culminating in its first release by ISO as ISO/IEC 17799:2000 in December 2000.

In 2006, adoption of BS 7799 Part 2 for ISO standardization was completed and now forms ISO27001.

ISO17799 vs. ISO27001

  • ISO17799 is a code of practice – like COBIT it deals with ‘what’, not ‘how’.
  • ISO27001 This is the ’specification’ for an Information Security Management System (ISMS). It is the means to measure, monitor and control security management from a top down perspective. It essentially explains how to apply ISO 17799 and it is this part that can currently be certified against

Unlike COBIT, ISO17799 does not include any maturity model sections for evaluation. (incidentally, nor does ISO9000)

ISO 17799 is a code of practice for information security. It details hundreds of specific controls which may be applied to secure information and related assets. It comprises 115 pages organized over 15 major sections.

ISO 27001 is a specification for an Information Security Management System, sometimes abbreviated to ISMS. It is the foundation for third party audit and certification. It is quite small because it doesn’t actually list the controls, but more a methodology for auditing and measuring. It comprises 34 pages over 8 major sections.

ISO17799 is:

  • an implementation guide based on suggestions.
  • used as a means to evaluate and build a sound and comprehensive information security program.
  • a list of controls an organization "should" consider.

ISO27001 is:

  • an auditing guide based on requirements.
  • used as a means to audit an organizations information security management system.
  • a list of controls an organization "shall" address.

ISO17799 Domains

  • Security Policy
  • Security Organization
  • Asset Management
  • Personnel Security
  • Physical and Environmental Security
  • Communications and Operations Management
  • Access Control
  • System Development and Maintenance
  • Business Continuity Management
  • Risk Assessment and Treatment
  • Compliance

ISO17799 divides up security into 12 domains.

Within each domain, information security control objectives (if you recall that is he same terminology as COBIT) are specified and a range of controls are outlined that are generally regarded as best practice means of achieving those objectives.

For each of the controls, implementation guidance is provided.

Specific controls are not mandated since each organization is expected to undertake a structured information security risk assessment process to determine its requirements before selecting controls that are appropriate to its particular circumstances (the introduction section outlines a risk assessment process

ISO/IEC 17799 is expected to be renamed ISO/IEC 27002 in 2007. The ISO/IEC 27000 series has been reserved for information security matters with a handful of related standards such as ISO/IEC 27001 having already been released and others such as ISO/IEC 27004 - Information Security Management Metrics and Measurement - currently in draft.

We will examine Asset Management domain as an example of ISO17799.

ISO17799 in relation to ITIL

  • ISO 17799 only addresses the selection and management of information security controls.
  • It is not interested in underlying implementation details. For example:
    • ISO 17799 is not interested that you have the latest and greatest logging and analysis products.
    • ISO 17799 is not interested in HOW you log.
    • Product selection is usually an operational efficiency issue (i.e. ITIL)
  • ISO 17799 is interested in:
    • WHAT you log (requirements).
    • WHY you log what you do (risk mitigation).
    • WHEN you log (tasks and schedules, window of vulnerability).
    • WHO is assigned log analysis duty (roles and responsibilities).
  • Satisfying these ISO 17799 interests produces defensible specifications and configurations that may ultimately influence product selection and deployment. (feeds into ITIL)

ISO17799 Example: Asset Management

  • 7.1 Responsibility for assets:
    • Objective:
    • To achieve and maintain appropriate protection of organizational assets. All assets should be accounted for and have a nominated owner.
    • Owners should be identified for all assets and the responsibility for the maintenance of appropriate controls should be assigned. The implementation of specific controls may be delegated by the owner as appropriate but the owner remains responsible for the proper protection of the assets.
  • 7.2 Information Classification
  • Implementation guidance is offered for all controls

Domain: Asset Management

7 Asset management

Control 7.1 Responsibility for assets

Control Objective: To achieve and maintain appropriate protection of organizational assets. All assets should be accounted for and have a nominated owner. Owners should be identified for all assets and the responsibility for the maintenance of appropriate controls should be assigned. The implementation of specific controls may be delegated by the owner as appropriate but the owner remains responsible for the proper protection of the assets.

7.1.1 Inventory of assets

Control

All assets should be clearly identified and an inventory of all important assets drawn up and maintained.

Implementation guidance

An organization should identify all assets and document the importance of these assets. The asset inventory should include all information necessary in order to recover from a disaster, including type of asset, format, location, backup information, license information, and a business value. The inventory should not duplicate other inventories unnecessarily, but it should be ensured that the content is aligned. In addition, ownership (see 7.1.2) and information classification (see 7.2) should be agreed and documented for each of the assets. Based on the importance of the asset, its business value and its security classification, levels of protection commensurate with the importance of the assets should be identified

Other information

There are many types of assets, including:

  • information: databases and data files, contracts and agreements, system documentation, research information, user manuals, training material, operational or support procedures, business continuity plans, fallback arrangements, audit trails, and archived information;
  • software assets: application software, system software, development tools, and utilities;
  • physical assets: computer equipment, communications equipment, removable media, and other equipment;
  • services: computing and communications services, general utilities, e.g. heating, lighting,power, and air-conditioning;
  • people, and their qualifications, skills, and experience;
  • intangibles, such as reputation and image of the organization.

Inventories of assets help to ensure that effective asset protection takes place, and may also be required for other business purposes, such as health and safety, insurance or financial (asset management) reasons. The process of compiling an inventory of assets is an important prerequisite of risk management

7.1.2 Ownership of assets

Control

All information and assets associated with information processing facilities should be owned2 by a designated part of the organization.

Implementation guidance

The asset owner should be responsible for:

  • ensuring that information and assets associated with information processing facilities are appropriately classified;
  • defining and periodically reviewing access restrictions and classifications, taking into account applicable access control policies.

Ownership may be allocated to:

  • a business process;
  • a defined set of activities;
  • an application; or
  • a defined set of data.

Other information

Routine tasks may be delegated, e.g. to a custodian looking after the asset on a daily bsis, but the responsibility remains with the owner.

In complex information systems it may be useful to designate groups of assets, which act together to provide a particular function as ’services’. In this case the service owner is responsible for the delivery of the service, including the functioning of the assets, which provide it.

7.1.3 Acceptable use of assets

Control

Rules for the acceptable use of information and assets associated with information processing facilities should be identified, documented, and implemented.

Implementation guidance

All employees, contractors and third party users should follow rules for the acceptable use of information and assets associated with information processing facilities, including:

  • rules for electronic mail and Internet usages (see 10.8);
  • guidelines for the use of mobile devices, especially for the use outside the premises of the organization (see 11.7.1);

Specific rules or guidance should be provided by the relevant management. Employees, contractors and third party users using or having access to the organization’s assets should be aware of the limits existing for their use of organization’s information and assets associated with information processing facilities, and resources. They should be responsible for their use of any information processing resources, and of any such use carried out under their responsibility.

The term ‘owner’ identifies an individual or entity that has approved management responsibility for controlling the production, development, maintenance, use and security of the assets. The term ‘owner’ does not mean that the person actually has any property rights to the asset.

ISO17799 Example: Asset Management

  • 7.1 Responsibility for assets:
  • 7.2 Information Classification
    • Objective:
    • To ensure that information receives an appropriate level of protection.
    • Information should be classified to indicate the need, priorities, and expected degree of protection when handling the information.
    • Information has varying degrees of sensitivity and criticality. Some items may require an additional level of protection or special handling. An information classification scheme should be used to define an appropriate set of protection levels and communicate the need for special handling measures
  • Implementation guidance is offered for all controls

7.2 Information classification

Objective: To ensure that information receives an appropriate level of protection.

Information should be classified to indicate the need, priorities, and expected degree of protection when handling the information.

Information has varying degrees of sensitivity and criticality. Some items may require an additional level of protection or special handling. An information classification scheme should be used to define an appropriate set of protection levels and communicate the need for special handling measures.

7.2.1 Classification guidelines

Control

Information should be classified in terms of its value, legal requirements, sensitivity, and criticality to the organization.

Implementation guidance

Classifications and associated protective controls for information should take account of business needs for sharing or restricting information and the business impacts associated with such needs. Classification guidelines should include conventions for initial classification and reclassification over time; in accordance with some predetermined access control policy (see 11.1.1). It should be the responsibility of the asset owner (see 7.1.2) to define the classification of an asset, periodically review it, and ensure it is kept up to date and at the appropriate level. The classification should take account of the aggregation effect mentioned in 10.7.2. Consideration should be given to the number of classification categories and the benefits to be gained from their use. Overly complex schemes may become cumbersome and uneconomic to use or prove impractical. Care should be taken in interpreting classification labels on documents from other organizations, which may have different definitions for the same or similarly named labels.

Other Information

The level of protection can be assessed by analyzing confidentiality, integrity and availability and any other requirements for the information considered.

Information often ceases to be sensitive or critical after a certain period of time, for example, when the information has been made public. These aspects should be taken into account, as over-classification can lead to the implementation of unnecessary controls resulting in additional expense.

Considering documents with similar security requirements together when assigning classification levels might help to simplify the classification task.

In general, the classification given to information is a shorthand way of determining how this information is to be handled and protected.

7.2.2 Information labeling and handling

Control

An appropriate set of procedures for information labeling and handling should be developed and implemented in accordance with the classification scheme adopted by the organization.

Implementation guidance

Procedures for information labeling need to cover information assets in physical and electronic formats.

Output from systems containing information that is classified as being sensitive or critical should carry an appropriate classification label (in the output). The labeling should reflect the classification according to the rules established in 7.2.1. Items for consideration include printed reports, screen displays, recorded media (e.g. tapes, disks, CDs), electronic messages, and file transfers. For each classification level, handling procedures including the secure processing, storage, transmission, declassification, and destruction should be defined. This should also include the procedures for chain of custody and logging of any security relevant event. Agreements with other organizations that include information sharing should include procedures to identify the classification of that information and to interpret the classification labels from other organizations.

Other Information

Labeling and secure handling of classified information is a key requirement for information sharing arrangements. Physical labels are a common form of labeling. However, some information assets, such as documents in electronic form, cannot be physically labeled and electronic means of labeling need to be used. For example, notification labeling may appear on the screen or display. Where labeling is not feasible, other means of designating the classification of information may be applied, e.g. via procedures or meta-data.

Benefits of Best Practices

  • Avoiding re-inventing wheels
  • Reducing dependency on technology experts
  • Increasing the potential to utilize less-experienced staff if properly trained
  • Making it easier to leverage external assistance
  • Overcoming vertical silos and nonconforming behavior
  • Reducing risks and errors
  • Improving quality
  • Improving the ability to manage and monitor
  • Increasing standardization leading to cost reduction
  • Improving trust and confidence from management and partners
  • Creating respect from regulators and other external reviewers
  • Safeguarding and proving value
  • Helps strengthen supplier/customer relations, make contractual obligations easier to monitor and enforce

There are also some obvious, but pragmatic, rules that management ought to follow:

  • Treat the implementation initiative as a project activity with a series of phases rather than a ‘one-off’ step.
  • Remember that implementation involves cultural change as well as new processes. Therefore, a key success factor is the enablement and motivation of these changes.
  • Make sure there is a clear understanding of the objectives.
  • Manage expectations. In most enterprises, achieving successful oversight of IT takes time and is a continuous improvement process.
  • Focus first on where it is easiest to make changes and deliver improvements and build from there one step at a time.
  • Obtain top management buy-in and ownership. This needs to be based on the principles of best managing the IT investment.
  • Avoid the initiative becoming perceived as a purely bureaucratic exercise.
  • Avoid the unfocused checklist approach.

Free Information: Aligning CT , ITIL and ISO 17799 for Business Benefit: http://www.itgovernance.co.uk/files/Aligning%20ITIL,%20CobiT,%2017799.pdf

  • IT best practices need to be aligned to business requirements and integrated with one another and with internal procedures.
  • COBIT can be used at the highest level, providing an overall control framework based on an IT process model that should generically suit every organization.
  • Specific practices and standards such as ITIL and ISO 17799 cover discrete areas and can be mapped to the COBIT framework, thus providing an hierarchy of guidance materials.

No Tags


IT Governance Standards: COBIT, ISO17799/27001, ITIL and PMBOK – Part 3

Tags: COBiT, Governance, ISO17799/27001, ITIL @ 12:34 am

The content of this blog is essentially material I compiled for training sessions that I ran last year. It was originally PowerPoint, but I hope that this blog version is useful. Some of the legislative stuff is probably now out of date, and it was for an Australian audience – moral of the story is to do your own research.

For part 1 of this presentation, view this post and part 2 this post.

IT Infrastructure Library (ITIL)

  • To facilitate Quality Management of IT Services
  • To improve efficiency, increase effectiveness and reduce risk
  • To provide codes of practice in support of Total Quality
  • ISO9000-compliant

The Information Technology Infrastructure Library (ITIL) is a framework of best practice approaches intended to facilitate the delivery of high quality information technology (IT) services. ITIL outlines an extensive set of management procedures that are intended to support businesses in achieving both quality and value for money in IT operations. These procedures are supplier independent and have been developed to provide guidance across the breadth of IT infrastructure, development, and operations.

The IT Infrastructure Library (ITIL) is so named as it originated as a collection of books each covering a specific ‘practice’ within IT management. After the initial published works, the number of publications quickly grew (within ITIL v1) to over 30 books. In order to make ITIL more accessible (and affordable) to those wishing to explore it, one of the aims of the ITIL v2 project was to consolidate the works into a number logical ’sets’ that aimed to group related sets of process guidelines for different aspects of the management of Information Technology systems, applications and services together.

Specifically, the goals of ITIL are to:

  • To facilitate Quality Management of IT Services
  • To improve efficiency, increase effectiveness and reduce risk
  • To provide codes of practice in support of Total Quality

As a side note, ITIL is ISO9000-compliant

How does ITIL Work

  • Provides guidance on strategic, tactical and operational management of IT infrastructure
  • Provides a systematic, process-based approach, supported by procedures
  • Suggests implementation strategies
  • Acts as a training aid
  • Vendor Independent
  • Complies with requirements for ISO9001 quality standards

Vendor Frameworks based on ITIL

ITIL is not vendor specific but many vendors base their own IT service quality on ITIL.

"The Microsoft Operations Framework (MOF) provides operational guidance that enables organizations to achieve mission-critical system reliability, availability, supportability, and manageability of Microsoft products and technologies. With MOF guidance, you’ll be able to assess your current IT service management maturity, prioritize your processes of greatest concern, and apply proven principles and best practices to optimize your management of the Windows Server platform."

ITIL Overview

  • ITIL is published as a series of books, each covering a major IT discipline
  • Service Support
  • Service Delivery
  • ICT Infrastructure Management
  • Application Management
  • Security
  • Each of these books break these disciplines down into sub areas. They define concept, goals, scope and relationship to other ITIL disciplines
  • Planning and implementation of each discipline
  • These are supported by three books which support the practical implementation of ITIL.
  • The Business Perspective
  • Planning to Implement Service Management
  • ITIL® Small-scale Implementation

The current version (Version 2) of ITIL is published in a series of books, each of which covers one major discipline in IT:

  • Service Support
  • Service Delivery
  • ICT Infrastructure Management
  • Application Management
  • Security

These are supported by three books which support the practical implementation of ITIL.

  • The Business Perspective
  • Planning to Implement Service Management
  • ITIL® Small-scale Implementation

As a quick example we will examine the "Service Delivery" Book

ITIL Example: Service Delivery

  • Service Delivery consists of 5 disciplines
    • Service Level Management
    • Capacity Management
    • IT Service Continuity Management
    • Financial Management for IT Services
    • Availability Management

Service Delivery consists of 5 disciplines

Service Level Management ensures that agreed services are delivered when and where they are supposed to be delivered.

There are a number of business processes that form part of Service Level Management. These are:

  • Reviewing existing services
  • Negotiating with the Customers
  • Reviewing the underpinning contacts of 3rd party service providers
  • Producing and monitoring the Service Level Agreement (SLA)
  • Implementation of Service Improvement policy and processes
  • Establishing priorities
  • Planning for service growth
  • Involvement in the Accounting process to cost services and recover these costs

Capacity Management is the discipline that ensures IT infrastructure is provided at the right time in the right volume at the right price, and ensuring that IT is used in the most efficient manner.

These are inputs into the following Capacity Management processes:

  • Performance monitoring
  • Workload monitoring
  • Application sizing
  • Resource forecasting
  • Demand forecasting
  • Modeling

From these processes come the results of capacity management, these being the capacity plan itself, forecasts, tuning data and Service Level Management guidelines.

ITIL Example: Service Delivery Continued

  • Service Delivery consists of 5 disciplines
    • Service Level Management
    • Capacity Management
    • IT Service Continuity Management
    • Financial Management for IT Services
    • Availability Management

Continuity Management / Disaster Recovery / Business Continuity. Continuity management is the process by which plans are put in place and managed to ensure that IT Services can recover and continue should a serious incident occur. It is not just about reactive measures, but also about proactive measures - reducing the risk of a disaster in the first instance.

Continuity management is so important that many organizations will not do business with IT service providers if contingency planning is not practiced within the service provider’s organization.

Continuity management involves the following basic steps:

  • Prioritizing the businesses to be recovered by conducting a Business Impact Analysis (BIA)
  • Performing a Risk Assessment (aka Risk Analysis) for each of the IT Services to identify the assets, threats, vulnerabilities and countermeasures for each service.
  • Evaluating the options for recovery
  • Producing the Contingency Plan
  • Testing, reviewing, and revising the plan on a regular basis

Availability Management is the practice of identifying levels of IT Service availability for use in Service Level Reviews with Customers. All areas of a service must be measurable and defined within the Service Level Agreement (SLA). To measure service availability the following areas are usually included in the SLA:

  • Agreement statistics – such as what is included within the agreed service.
  • Availability – agreed service times, response times, etc.
  • Help Desk Calls – number of incidents raised, response times, resolution times.
  • Contingency – agreed contingency details, location of documentation, contingency site, 3rd party involvement, etc.
  • Capacity – performance timings for online transactions, report production, numbers of users, etc.
  • Costing Details – charges for the service, and any penalties should service levels not be met.

IT Financial Management is the discipline of ensuring IT infrastructure is obtained at the most effective price (which does not necessarily mean cheapest), and calculating the cost of providing IT services so that an organization can understand the costs of its IT services. These costs may then be recovered from the Customer of the service.Costs are divided into costing units:

  • Equipment
  • Software
  • Organization (staff, overtime)
  • Accommodation
  • Transfer (costs of 3rd party service providers)

The costs are divided into Direct and Indirect costs, and can be Capital or Ongoing.

Drilldown: Service Level Management

  • 4.1: Why, goal, scope and concept
  • 4.2: Defined process to implement – benefits, costs, problems
  • 4.3: Planning the SLM process
  • 4.4: Implementation of SLM (service catalogue)
  • 4.5: Ongoing monitoring and reporting
  • 4.6/7: KPI and performance targets
  • Annex 4A: Roles and requirements of SLM
  • Annex4B-D: Examples

4.1.1 Why Service Level Management?

Service Level Management (SLM) is essential in any organization so that the level of IT Service needed to support the business can be determined, and monitoring can be initiated to identify whether the required service levels are being achieved – and if not, why not.

Service Level Agreements (SLA), which are managed through the SLM process, provide specific targets against which the performance of the IT organization can be judged.

4.1.2 Goal for SLM

The goal for SLM is to maintain and improve IT Service quality, through a constant cycle of agreeing, monitoring and reporting upon IT Service achievements and instigation of actions to eradicate poor service – in line with business or cost justification. Through these methods, a better relationship between IT and its Customers can be developed.

4.1.3 Scope for SLM

SLA’s should be established for all IT Services being provided. Underpinning Contracts and Operational Level Agreements (OLA’s) should also be in place with those suppliers (external and internal) upon whom the delivery of service is dependent.

4.1.4 Basic concept of SLM

Service Level Management is the name given to the processes of planning, coordinating, drafting, agreeing, monitoring and reporting on SLA’s , and the on-going review of service achievements to ensure that the required and cost-justifiable service quality is maintained and gradually improved. SLA’s provide the basis for managing the relationship between the provider and the Customer.

When the first ITIL SLM book was published in 1989, very few organizations had SLA’s in place. Today most organizations have introduced them – though with varying degrees of success. This version includes some coverage of the common causes of failure, and guidance on how to overcome these difficulties.

What is an SLA?

A written agreement between an IT Service Provider and the IT Customer(s), defining the key service targets and responsibilities of both parties. The emphasis must be on agreement and SLA’s should not be used as away of holding one side or the other to ransom. A true partnership should be developed between the IT provider and the Customer, so that a mutually beneficial agreement is reached, otherwise the SLA could quickly fall into disrepute and a culture of blame prevent any true service quality improvements from taking place.

In the next part of this series, we will examine ISO17799

For the last post of this topic, consult this post.

No Tags


IT Governance Standards: COBIT, ISO17799/27001, ITIL and PMBOK – Part 2

Tags: COBiT, Governance, ISO17799/27001, ITIL @ 12:05 am

The content of this blog is essentially material I compiled for training sessions that I ran last year. It was originally PowerPoint, but I hope that this blog version is useful. Some of the legislative stuff is probably now out of date, and it was for an Australian audience – moral of the story is to do your own research.

For part 1 of this presentation, view this post.

Framework Strengths

  • COBIT is strong in IT controls and IT metrics (measurable). But it does not say how
  • ISO17799 is strong in security controls but also does not say how
  • ITIL is strong in IT processes (i.e. the how)

COBIT is based on established frameworks, such as the Software Engineering Institute’s Capability Maturity Model, ISO 9000, ITIL and ISO 17799. However, COBIT does not include process steps and tasks because, although it is oriented toward IT processes, it is a control and management framework rather than a process framework.

COBIT focuses on what an enterprise needs to do, not how it needs to do it. Across many aspects of an organizations activities, the board really doesn’t care about the ‘HOW’, they just want to see the ‘need’ addressed. Thus, target audience for COBIT is senior business management, senior IT management and auditors.

ITIL is based on defining best practice processes for IT service management and support, rather than on defining a broad-based control/measurement framework. It focuses on the methods and defines a more comprehensive set of processes.

Due to its high level and broad coverage and because it is based on many existing practices, COBIT is often referred to as the ‘integrator’, bringing disparate practices under one umbrella and, just as important, helping to link these various IT practices to business requirements.

ISO17799 is a more similar to COBIT than ITIL in that it is control driven, not process driven. However it is applied specifically to the area of IT security and thus drills down to a lower level than COBIT. The audience is also more focused from senior management/executive to IT and business unit management.

COBIT

  • Business orientation is the main theme of COBIT
  • 34 high-level control objectives
  • Grouped into four domains:
  • Plan and Organize
  • Acquire and Implement
  • Deliver and Support
  • Monitor.
  • IT governance guidance is also provided
  • 318 Detailed control objectives (not today!)
  • Maturity models, CSF, KGI, KPI

Business orientation is the main theme of COBIT. It is designed to be employed not only by users and auditors, but also, and more important, as comprehensive guidance for management and business process owners. Increasingly, business practice involves the full empowerment of business process owners so they have total responsibility for all aspects of the business process. In particular,