"Ain’t it cool?" – Integrating SharePoint and real-time performance data – Part 2
Hi again
This article is the second half of a pair of articles explaining how I integrated real-time performance data with an SharePoint based IT operational portal, designed around the principle of passive compliance with legislative or organisational controls.
In the first post, I introduced the PI product by OSIsoft, and explained how SQL Reporting services is able to generate reports from more than just SQL Server databases. I demonstrated how I created a report server report from performance data stored in the PI historian via an OLE DB provider for PI, and I also demonstrated how I was able to create a report that accepted a parameter, so that the output of the report could be customised.
I also showed how a SharePoint provides a facility to enter parameter data when using the report viewer web part.
We will now conclude this article by explaining a little about my passively compliant IT portal, and how I was able to enhance it with seamless integration with the real-time performance data stored in the PI historian.
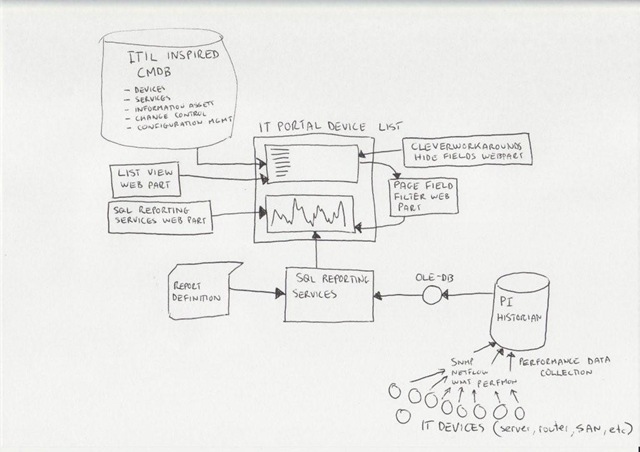
Just to remind you, here is my conceptual diagram in "acoustic Visio" format
The IT portal
This is the really ultra brief explanation of the thinking that went into my IT portal
I spent a lot of time thinking about how critical IT information could be stored in SharePoint to achieve the goals of quick and easy access to information, make tasks like change/configuration management more transparent and efficient, as well as capture knowledge and documentation. I was influenced considerably by ISO17799 as it was called back then, especially in the area of asset management. I liked the use of the term "IT Assets" in ISO17799 and the strong emphasis on ownership and custodianship.
ISO defined asset as "any tangible or intangible thing that has value to an organization". It maintained that "…to achieve and maintain appropriate protection of organizational assets. All assets should be accounted for and have a nominated owner. Owners should be identified for all assets and the responsibility for the maintenance of appropriate controls should be assigned. The implementation of specific controls may be delegated by the owner as appropriate but the owner remains responsible for the proper protection of the assets."
That idea of delegation is that an owner of an asset can delegate the day-to-day management of that asset to a custodian, but the owner still bears ultimate responsibility.
So I developed a portal around this idea, but soon was hit by some constraints due to the broad ISO definition of an asset. Since assets have interdependencies, geeks have a tendency to over-complicate things and product a messy web of interdependencies. After some trial and error, as well as some soul searching I was able to come up with a 3 tier model that worked.
|
I changed the use of the word "asset", and split it into three broad asset types.
|
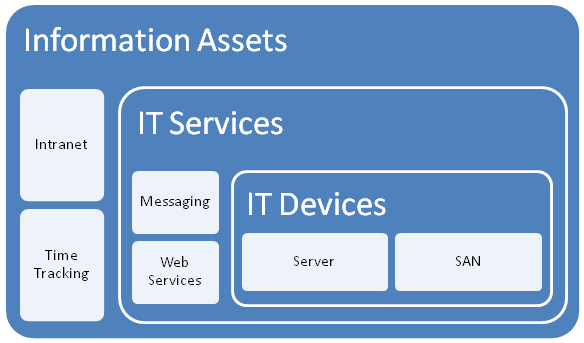 |
The main thing to note about this model is to explain the different between an IT Service and an Information Asset. The distinction is in the area of ownership. In the case of an "Information Asset", the ownership of that asset is not IT. IT are a service provider, and by definition the IT view of the world is different to the rest of the organisation. An "IT Service" on the other hand, is always owned by IT and it is the IT services that underpin information assets.
So there is a hierarchical relationship there. You can’t have an information asset without an IT service providing it. Accountabilities are clear also. IT own the service, but are not responsible for the information asset itself – that’s for other areas of the organisation. (an Information Asset can also depend on other information assets as well as many IT services.
While this may sound so obvious that its not worth writing, my experience is that IT department often view information assets and the services providing those assets as one and the same thing.
Devices and Services
So, as an IT department, we provide a variety of services to the organisation. We provide them with an IP network, potentially a voice over IP system, a database subsystem, a backup and recovery service, etc.
It is fairly obvious that each IT service consists of a combination of IT devices (and often other IT services). an IP network is an obvious one and a basic example. The devices that underpin the "IP Network" service are routers, switches and wireless access points.
For devices we need to store information like
- Serial Number
- Warranty Details
- Physical Location
- Vendor information
- Passwords
- Device Type
- IP Address
- Change/Configuration Management history
- IT Services that depend on this device (there is usually more than 1)
For services, we need to store information like
- Service Owner
- Service Custodian
- Service Level Agreement (uptime guarantees, etc)
- Change/Configuration Management history
- IT Devices that underpin this service (there is usually more than 1)
- Dependency relationships with other IT services
- Information Assets that depend on this IT service
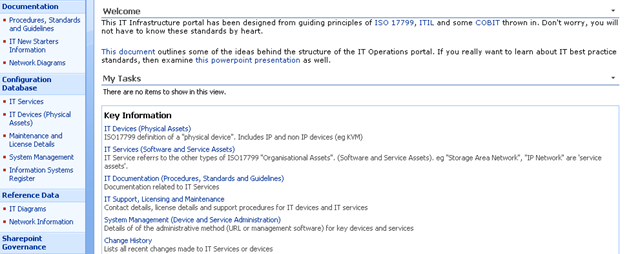
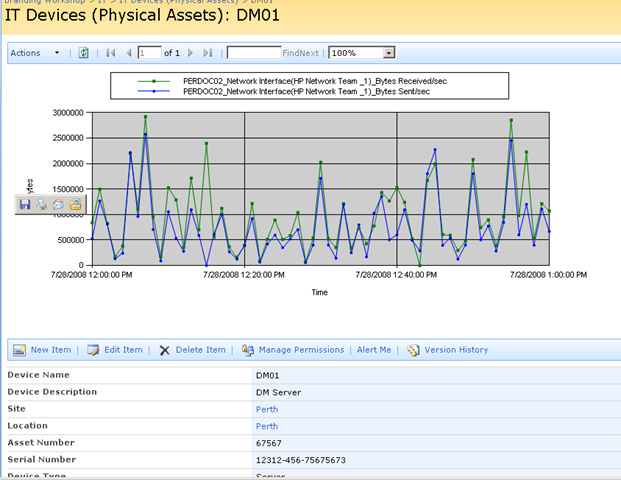
Keen eyed ITIL practitioners will realise that all I am describing here is a SharePoint based CMDB. I have a site template, content types, lists, event handlers and workflows that allow the above information to be managed in SharePoint. Below is three snippets showing sections of the portal, drilling down into the device view by location (click to expand), before showing the actual information about the server "DM01"
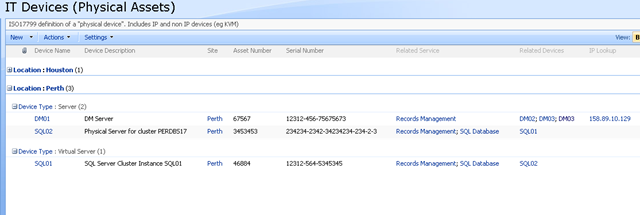
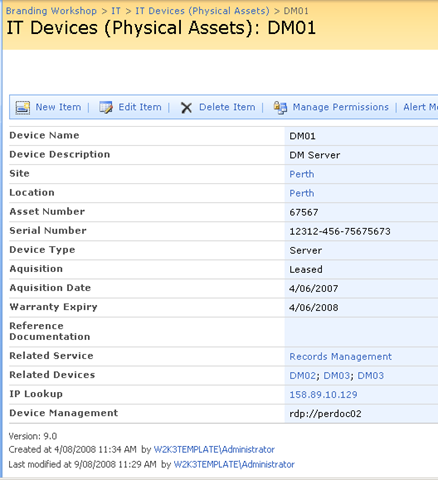
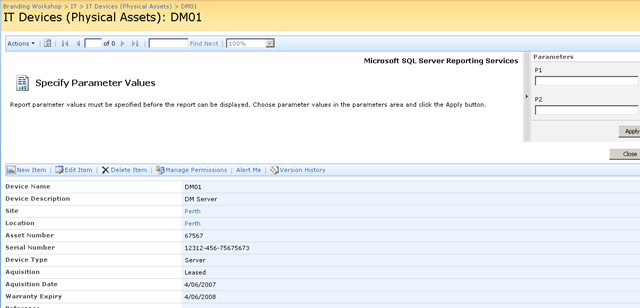
Now the above screen is the one that I am interested in. You may also notice that the page above is a system generated page, based on the list called "IT Devices". I want to add real-time performance data to this screen, so that as well as being able to see asset information about a device, I also want to see its recent performance.
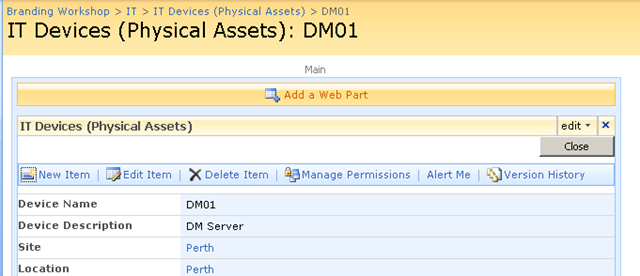
Modifying a system page
I talked about making modifications to system pages in detail in part 3 of my branding using Javascript series. Essentially, a system page is an automatically generated ASPX page that SharePoint creates. Think about what happens each time you add a column to a list or library. The NewForm.aspx, Editform.Aspx and Dispform.aspx are modified as they have to be rebuild to display the new or modified column.
SharePoint makes it a little tricky to edit these pages on account of custom modifications running the risk of breaking things. But as I described in the branding series, using the ToolPaneView hack does the job for us in a safe manner.
So using this hack, I was able to add a report viewer web part to the Dispform.aspx of the "IT devices" list as shown below.
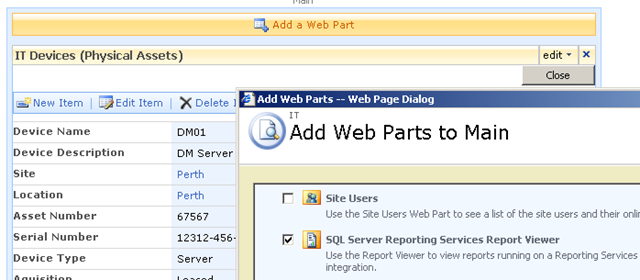
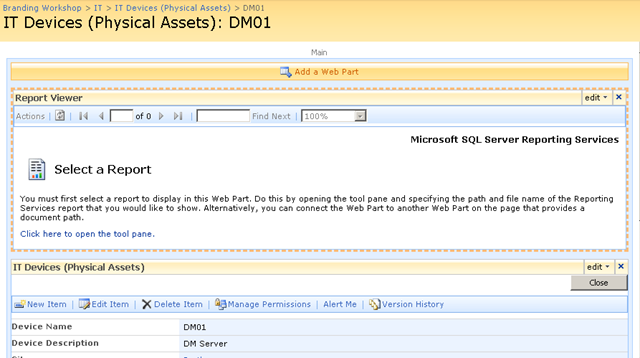
Finally, we have our report viewer webpart, linked to our report that accesses PI historian data. As you can see below, the report that I created actually is expecting two parameters to be supplied. These parameters will be used to retrieve specific performance data and turn it into a chart.
Web Part Connection Magic
Now as it stands, the report is pretty much useless to us in the sense that we have to enter parameters to it manually, to get it to actually present us the information that we want. But on the same page as this report is a bunch of interesting information about a particular device, such as its name, IP Address, location and description. Wouldn’t it be great if we could somehow pass the device name (or some other device information) to the report web part automatically.
That way, each time you opened up a device entry, the report would retrieve performance information for the device currently being viewed. That would be very, very cool.
Fortunately for us it can be easily done. The report services web part, like many other web parts is connectable. This means that it can accept information from other web parts. This means that it is possible to have the parameters automatically passed to the report!
Wohoo!
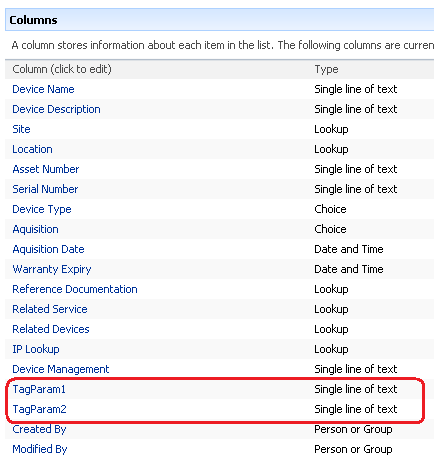
So here is how I am going to do this. I am going to add two new columns to my device list. Each column will be the parameter passed to the report. This way, I can tailor the report being generated on a device by device basis. For example, for a SAN device I might want to report on disk I/O, but a server I might want CPU. If I store the parameter as a column, the report will be able to retrieve whatever performance data I need.
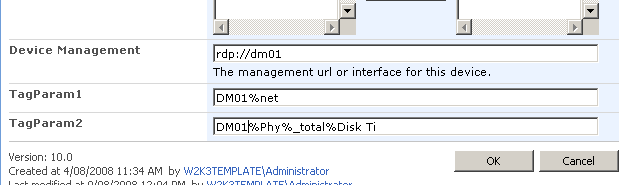
Below shows the device list with the additional two columns added. the columns are called TAGPARAM1 and TAGPARAM2. The next screen below, shows the values I have entered for each column against the device DM01. These values will be passed to the report server report and used to find matching performance data.
So the next question becomes, how do I now transparently pass these two parameters to the report? We now have the report and the parameters on the same page, but no obvious means to pass the value of TagParam1 and TagParam2 to the report viewer web part.
The answer my friends, is to use a filter web part!
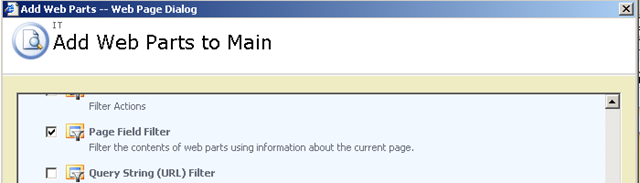
Using the toolpane view hack, we once again edit the view item page for the Device List. We now need to add two additional web parts (because we have two parameters). Below is the web part to add.
The result should be a screen looking like the figure below
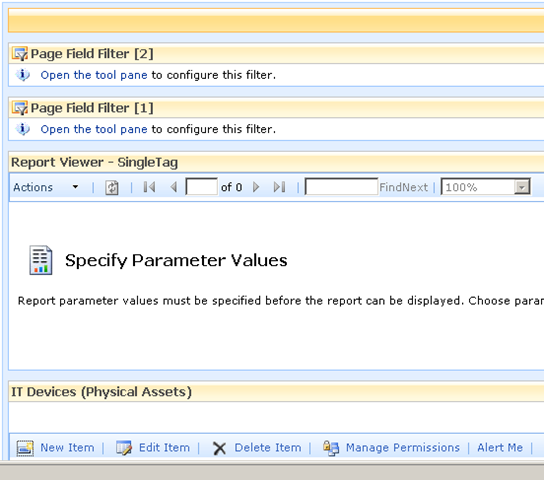
Filter web parts are not visible when a page is rendered in the browser. They are instead used to pass data between other web parts. There are various filter web parts that work in different ways. The Page Field filter is capable of passing the value of any column to another web part.
Confused? Check out how I use this web part below…
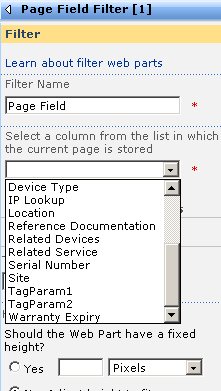
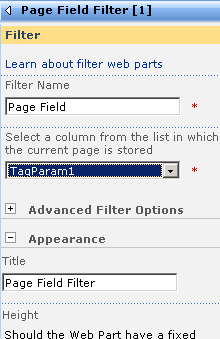
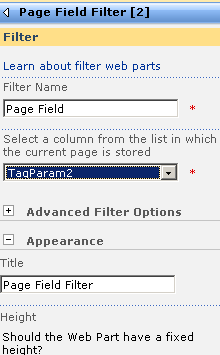
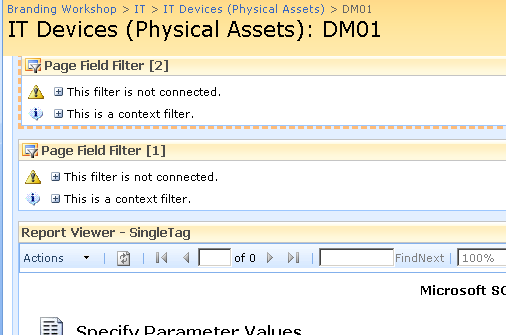
The screen above shows that the two Page Field filters web parts are not configured. They are prompting you to open the tool pane and configure them. Below is the configuration pane for the page field filter. Can you see how it has enumerated all of the columns for the "IT device" list? In the second and third screen we have chosen TagParam1 for the first page filter and TagParam2 for the second page filter web part.
Now take a look at the page in edit mode. The page filters now change display to say that they are not connected. All we have done so far is tell the web parts which columns to grab the parameter values from
Almost Home – Connecting the filters
So now we need to connect each Page Field filter web part to the report viewer web part. This will have the effect of passing to the report viewer web part, the value of TagParam1 and TagParam2. Since these values change from device to device, the report will display unique data for each device.
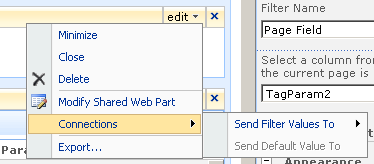
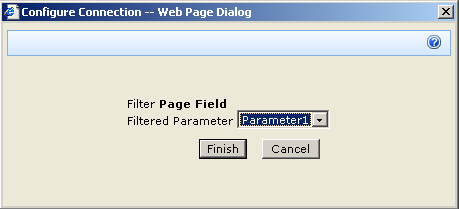
To to connect each page filter web part you click the edit dropdown for each page filter. From the list of choices, choose "Connections", and it will expand out to the choice of "Send Filter Values To". If you click on this, you will be promoted to send the filter values to the report viewer web part on the page. Since in my example, the report viewer web part requires two parameters, you will be asked to choose which of the two parameters to send the value to.
Repeat this step for both page filter web parts and something amazing happens, we see a performance report on the devices page!! The filter has passed the values of TagParam1 and tagParam2 to the report and it has retrieved the matching data!
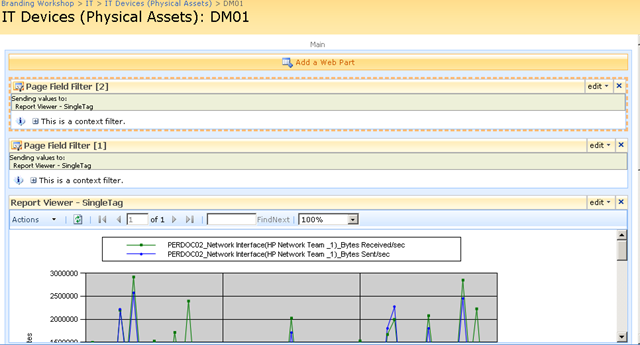
Let’s now save this page and view it in all of its glory! Sweet eh!
Conclusion (and Touchups)
So let’s step back and look at what we have achieved. We can visit our IT Operations portal, open the devices list and immediately view real-time performance statistics for that device. Since I am using a PI historian, the performance data could have been collected via SNMP, netflow, ping, WMI, Performance Monitor counters, a script or many, many methods. But we do not need to worry about that, we just ask PI for the data that we want and display it using reporting services.
Because the parameters are stored as additional metadata with each device, you have complete control over the data being presented back to SharePoint. You might decide that servers should always return CPU stats, but a storage area network return disk I/O stats. It is all controllable just by the values you enter into the columns being used as report parameters.
The only additional thing that I did was to use my CleverWorkArounds Hide Field Web Part, to subsequently hide the TagParam1 and TagParam2 fields from display, so that when IT staff are looking at the integrated asset and performance data, the ‘behind the scenes’ glue is hidden from them.
So looking at this from a IT portal/compliance point of view, we now have an integrated platform where we can:
- View device asset information (serial number, purchase date, warranty, physical location)
- View IT Service information (owners, custodians and SLA’s)
- View Information Asset information (owners, custodians and SLA’s)
- Understand the relationships between devices, services and information assets
- Access standards, procedures and work instructions pertaining to devices, services and information assets
- Manage change and configuration management for devices, services and information assets
- Quickly and easily view detailed, real time performance statistics of devices
All in all, not a bad afternoons work really! And not one line of code!
As i said way back at the start of the first article, this started out as a quick idea for a demo and it seems to have a heck of a lot of potential. Of course, I used PI but there is no reason why you can’t use similar techniques in your own IT portals to integrate your operational and performance data into the one place.
I hope that you enjoyed this article and I look forward to feedback.
<Blatant Plug>Want an IT Portal built in passive compliance? Then let’s talk!</Blatant Plug>
cheers
Paul Culmsee
OSISoft addendum
Now someone at OSISoft at some point will read this article and wonder why I didn’t write about RTWebparts. Essentially PI has some web parts that can be used to display historian data in SharePoint. There were two reasons why I did not mention them.
- To use RTWebparts you have to install a lot of PI components onto your web front end servers. Nothing wrong with that, but with Report Services, those components only need to go onto the report server. For my circumstances and what I had to demonstrate, this was sufficient.
- This post was actually not about OSISoft or PI per se. It was used to demonstrate how it is possible to use SharePoint to integrate performance and operational information into one integrated location. In the event that you have PI in your enterprise and want to leverage it with SharePoint, I suggest you contact me about it because we do happen to be very good at it 🙂
I like the SharePoint-based CMDB concept. Do you have the site template and component lists available for download?
Thanks! Dave
No i don’t, this template comes with engagements with clients sorry – it tends to get customised depending on client circumstances
hi I really like the way u implement the IT device CMDB template.. I would like to implement the same at client site and requrements are same so plzz give me the link to download the templae and other contents.
A lot of good work about getting info into SharePoint from the PI Archive (even if that data source wasn’t your prime interest). But,what about going the other way? How would you write new timestamped values back to PI?
Are the information in your CMDB manually entered or did you use any tools to automatically pull some of the information? If so, what tools did you use?
I am currently trying to come up with something similar and I am looking for a solution to automatically discover system information such as IP address, OS, Gateway, etc.
Interesting read (pt 1 & 2), thanks Paul!! Just starting to get in to a PI development. New to it, so I’m out absorbing what I can
sorry i’m not quite understand..
u mean.. u pull performance data from PI Historian via SQL Reporting Service ..?
if so, how to configure that…
tq