Demystifying SharePoint Performance Management Part 2 – So what is RPS anyway?
Hi all
I never mentioned it in the first post that the reason I am blogging again is I finally completed most of the game Skyrim. Man – that game is dangerous if you value your time!
Anyway, in the first post, I introduced this series by covering the difference between lead and lag performance indicators. To recap from part 1, a lead indicator is something that can help predict an outcome by measuring an action, whereas a lag indicator measures the result or outcome achieved from taking an action. This distinction is important to understand, because otherwise it is easy to use performance measurements inappropriately or get very confused. Lead indicators in particular sometimes feel wishy washy because it is hard to have a direct correlation to what you are seeing.
In this post, we are going to examine one of the most commonly cited (and abused) lead indicators to measure for performance. Good old Requests Per Second (RPS). Let’s attempt to make this more clear…
Microsoft defines RPS as:
The number of requests received by a farm or server in one second. This is a common measurement of server and farm load. The number of requests processed by a farm is greater than the number of page loads and end-user interactions. This is because each page contains several components, each of which creates one or more requests when the page is loaded. Some requests are lighter than other requests with regard to transaction costs. In our lab tests and case study documents, we remove 401 requests and responses (authentication handshakes) from the requests that were used to calculate RPS because they have insignificant impact on farm resources
So according to this definition, RPS is any interaction between browsers (or any other device or service making web requests) and the SharePoint webserver, excluding authentication traffic. The logic of measuring requests per second is that it provides insight into how much load your SharePoint box can take because, after all, SharePoint at the end of the day is servicing requests from users.
RPS by example
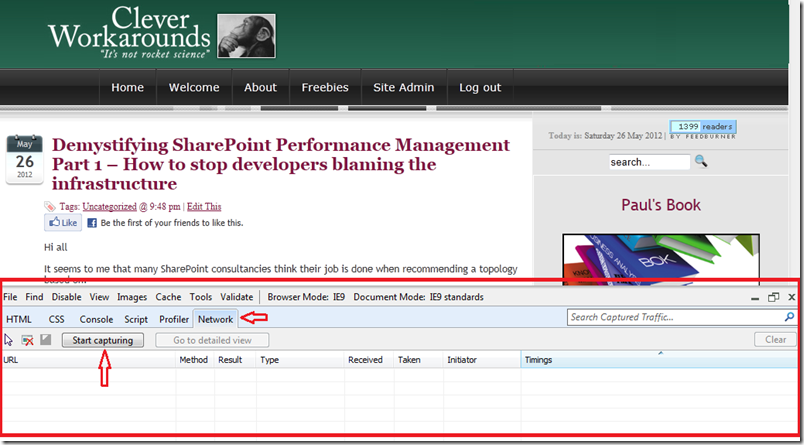
Before we start picking apart RPS and its issues, let’s look at an example. Assuming you are viewing this page in Internet Explorer version 8 or 9, press F12 right now. You should see something like the screen below. If you have not seen it before, it is called the internet explorer developer tools and is bloody handy. Now click on the “Network” link, highlighted below and then click the “Start capturing” button.
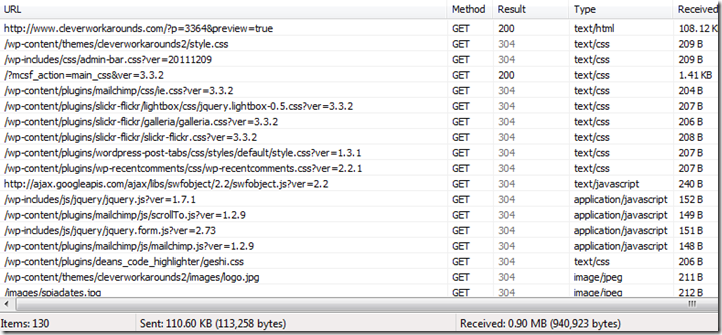
Now refresh this page and watch the result. You should see a bunch of activity logged, looking something like the picture below.
What you are looking at is all of the requests that your browser has made to load this very page. While the detail is not overly important for the purpose of this post, the key point is that to load this page, many requests were made. In fact if you look in the left-bottom corner of the above screenshot, a total of 130 individual requests are listed.
So, first pop-quiz for the day: Were all 130 requests made to my cleverworkarounds blog to refresh this page? The answer my friends is no. In actual fact, only 2 items were loaded from my blog!
So why the discrepancy? What happened to the other 128 requests? Two main reasons.
1. Browser cache: First up, many of the items listed above were cached by my browser already. I’ve been to this site before, and so a lot of the page components (CSS style sheets, logos and the like) did not have to be retrieved again. It just happens that the internet explorer developer tool shows requests that were handled by locally cached data as well as actual requests made to SharePoint. If you look closely at the “Result” column in the above screenshot, you will see that some entries are grey colour while others are black. All of the grey entries are cached requests. They never left the confines of the browser. This alone accounts for 95 of the 130 requests.
Now this is worth consideration because if a browser has never accessed this site before, there will be no content in the browser cache. Therefore, on first access, the browser would indeed have made 95 additional requests to load the page. This scenario is most likely on day one of a production SharePoint rollout, where a large chunk of the workforce might load the homepage for the first time.
2. Content from other sites: The second reason for the discrepancy is that some content doesn’t even come from the cleverworkarounds site. Anytime you visit a blog and it has a snazzy widget like Amazon books or Facebook “like” buttons, that content is very likely being retrieved from Amazon or Facebook. In the case of this very article you are reading, 33 requests were made to other sites like Facebook, amazon, feedburner, sharepointads and whoever else happens to grace a widget on the right hand side. In these cases, my server is not handling this traffic at all. This accounts for 33 of the 130 requests.
95 + 33 = 128 of the 130 requests made.
So hopefully now you get what is meant by RPS. Let’s now look at its utility in measuring performance.
Dangers of RPS reliance…
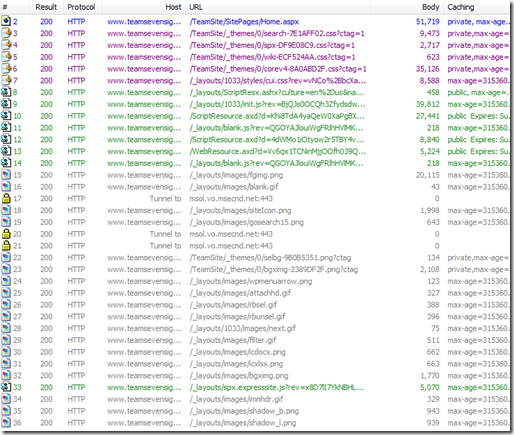
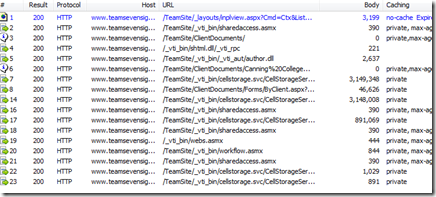
Consider two fairly typical SharePoint transactions: The first example is loading the SharePoint home page and the second example is where a user loads a document from a SharePoint document library. Below I have compared the two transactions by using an Office 365 site of mine and capturing the requests made by each one. (For what its worth, I used a utility called fiddler rather than the developer toolbar because it has some snazzier features).
In example #1, we have loaded the homepage of an Office365 site (assuming for the first time). In all, 36 requests made to the server. If we add up the amount of data returned by the server (summing the “Body” column below), we have a total of 245,322 bytes received.
In request #2, we are looking at the trace of me opening a 7 megabyte document from a document library. Notice that this time, 17 requests were. But compared to the first example, significantly more data was returned from the server: 7,245,876 KB in fact. If you drill down further by examining the “Body” column, you will notice that of those 17 requests, 3 of them were the bulk of the data transferred with 3,149,348, 3,148,008 and 891,069 KB respectively.
So here is my point. Some requests are more significant than others! In the latter example, 3 of the 17 requests transferred 98% of the data. The second transaction also took much longer than the first, and the data was retrieved from the SQL Server database, which meant that this interaction with SharePoint likely had more back-end performance load than the first example when the home page was loaded. When loading the home page, the data may have been served from one of the many SharePoint caches and barely touching the back-end SQL box.
Now with that in mind, consider this: The typical rationale you see around the interweb for utilising RPS as a performance tool is to estimate future scalability requirements. Statements like "This SharePoint farm needs to be capable of 125RPS” are fairly common. Traditionally, the figure was derived from a methodology that looked something like:
- Work out the peak times of the day for SharePoint site usage (for example between 10:45am-2:45pm each day)
- Estimate the number of concurrent users accessing your SharePoint site during this time
- Classify the users via their usage profile (wussy, light, heavy, psycho, etc)
- Estimate how many transactions each of these user types might make in the peak hour (a transaction being an operation like browse home page, edit document, and so on)
- Multiply concurrent users by the number of expected transactions to derive the total number of transactions for the period
- Divide the total by the number of seconds in the period to work out how many transactions per second.
There are lots of issues with this methodology, but here are 4 obvious ones.
- The first is that it confuses transactions with requests. While browsing the SharePoint home page might be considered one “transaction”, it will likely consist of more than one request (particularly if the content being served is designed to be fairly dynamic and not rely on cache data). Essentially this methodology may underestimate the number of requests because it assumes a 1:1 relationship between a transaction and a request. My two examples above demonstrate that this is not the case.
- The classification of usage profile of users (light, medium, heavy) is crude and overlooks the aforementioned variation in usage patterns. A “heavy user” might continually update a SharePoint calendar, while a “light” user might load 20 megabyte documents or run sophisticated reports. In both cases, the real load on the infrastructure – and the resulting response time – may be quite varied.
- It fails to take into consideration the fact that SharePoint 2010 in particular has many new features in the form of Service Applications. These also make requests behind the scenes that have load implications. The most obvious example is the search crawling SharePoint sites.
- It also overlooks the fact that SharePoint content is often accessed indirectly. Many non-browser client tools such as SharePoint Workspace, OneNote, Outlook Social Connector, Harmon.ie and the like. If Colligo Contributor is deployed to all desktops, does that make all users “heavy?”
So hopefully by now, you can understand the folly of saying to someone “This system should be capable of handling 150RPS.” There is simply far too many variables that contribute to this, and each request can be wildly different in terms of real load on the back-end servers. Now you know why Robert Bogue likened this issue to Drakes Equation in part 1. The RPS target arrived at utilising this sort of methodology is likely to be fairly inaccurate and of questionable value.
So what is RPS good for and how do I get it?
So am I anti RPS? Definitely not!
The one thing RPS has going for it, which makes it incredibly useful, is that it is likely to be the one performance metric that any organisation can tap into straight away (assuming you have an existing deployment). This is because the metric is collected in web server (IIS) logs over time. Each request made to the server is logged with a date and timestamp. For most places, this is the only high fidelity performance data you have access to, because many organisations do not collect and store other stats like CPU and Disk IO performance over time. While its unlikely you would be able to see CPU for a server 6 months ago on Tuesday at 9:53am, chances are you can work out the RPS at that time if you have an existing intranet or portal. The reason for this is that IIS logs are not cleared so you have the opportunity to go back in time and see how a SharePoint site has been utilised.
The benefit is that we have the means to understand past performance patterns of an organisations use of their intranet or portal. We can work out stuff like:
- peak times of the day for usage of the portal based on previous history
- the maximum number of requests that the server has ever had to process
- the rate of increase/decrease of RPS over time (ie “What was peak RPS 6 months ago? What was it 3 months ago?)
- the patterns/distribution of requests over a typical day (peaks and troughs – we can see the “shape” of SharePoint usage over a given period)
As an added bonus, the data in web server logs allow for some other fringe benefits including stuff like:
- the percentage or pattern of requests were “non interactive” (such as % of requests that are search crawls or SharePoint workspace sync’s)
- identifying usage patterns of certain users (eg top 10 users and their usage usage patterns)
Finally, if you monitor CPU and disk performance, you can compare the RPS peaks against those other performance counters and then interpolate how things might have been in the past (although this has some caveats too).
Coming up next…
Okay so now you are convinced that RPS does not suck – and you want to get your hands on all this RPS goodness. The good news is that its fairly easy to do and Microsoft’s Mike Wise has documented the definitive way to do it. The bad news is, you have to download and learn a yet another utility. Fear not though as the utility (called LogParser) is brilliant and needs to be in your arsenal anyway (especially business oriented SharePoint readers of this blog – this is not one just for the techies). Put simply, LogParser provides the ability to do SQL-like queries to your log files. You can have it open a log file (or series of files), process them via a SQL style language, and then output the results of your query into different formats for reporting.
But, just as I have whetted your appetite, I am going to stop.This post is already getting large and I still have a bit to get through in relation to using LogParser, so I will focus on that in the next post.
Hopefully though at this point, you don’t totally hate RPS, have a much better idea of what RPS is and some of the issues of its use.
Thanks for reading
Paul Culmsee


June 5th, 2012 at 9:42 pm |
[…] Demystifying SharePoint Performance Management Part 2–So What is RPS Anyway? (Clever Workarounds)I never mentioned it in the first post that the reason I am blogging again is I finally completed most of the game Skyrim. Man – that game is dangerous if you value your time! Anyway, in the first post, I introduced this series by covering the difference between lead and lag performance indicators. To recap from part 1, a lead indicator is something that can help predict an outcome by measuring an action, whereas a lag indicator measures the result or outcome achieved from taking an action. This distinction is important to understand, because otherwise it is easy to use performance measurements inappropriately or get very confused. Lead indicators in particular sometimes feel wishy washy because it is hard to have a direct correlation to what you are seeing. […]
June 6th, 2012 at 5:07 am |
[…] SharePoint Performance Management Part 1 – How to stop developers blaming the infrastructureDemystifying SharePoint Performance Management Part 2–so what is RPS anyway?Demystifying SharePoint Performance Management Part 3 – Getting at RPS Hi and welcome back to […]
June 9th, 2012 at 8:58 am |
[…] SharePoint Performance Management Part 1 – How to stop developers blaming the infrastructureDemystifying SharePoint Performance Management Part 2–so what is RPS anyway?Demystifying SharePoint Performance Management Part 3 – Getting at RPSDemystifying SharePoint […]
December 16th, 2015 at 12:32 am |
Thanks for the post , analysing every bit of it.
December 23rd, 2016 at 7:14 am |
Now this is worth consideration because if a browser has never accessed this site before