Demystifying SharePoint Performance Management Part 3 – Getting at RPS
Hi and welcome back to this series aimed at making SharePoint performance management a little more digestible. In the first post we examined the difference between lead and lag indicators and in the second post, we specifically looked at the lead indicator of Requests Per Seconds (RPS) and its various opportunities and issues. In this episode we are actually going to do some real work at the – wait for it – the command line! As a result the collective heart rates of my business oriented readers – who are avid users of the “I’m business, not technical” cliché – will start to rise since anything that involves a command line is shrouded in mystique, fear, uncertainty and doubt.
For the tech types reading this article, please excuse the verboseness of what I go through here. I need to keep the business types from freaking out.
Okay… so in the last post I said that despite its issues in terms of being a reliable indicator of future performance needs, RPS has the advantage that it can be derived from your existing deployment. This is because the information needed is captured in web server (IIS) logs over time. Having this past performance means you have a lag indicator view of RPS, which can be used as a basis to understand what the future might look like with more confidence than some arbitrary “must handle x RPS.”
Now just because RPS is held inside web server log files, does not mean it is easy to get to. In this post, I will outline the 3 steps needed to manipulate logfiles to extract that precious RPS goodness. The utility that we are going to use to do this is Log parser.
Now a warning here: This post assumes your existing deployment runs on Microsoft’s IIS platform v7 (the webserver platform that underpins SharePoint 2010). If you are running one of the myriad of portal/intranet platforms, you are going to have to take this post as a guide and adjust to your circumstances.
Step 1: Getting Log parser
Installing Log parser is easy. Just install version 2.2 as you would any other tool. It will run on pretty much any Windows operating system. Once installed, it will likely reside in the C:\Program Files (x86)\Log Parser 2.2 folder. (Or C:\Program Files\Log Parser 2.2 if you have an older, 32 bit PC).
There you go business types – that wasn’t so hard was it?
Step 2: Getting your web server logs
After the relative ease of getting log parser installed, we now need the logs themselves to play with. We are certainly not going to mess with a production system so we will need to copy the log files for your current portal to the PC where you installed Log parser. If you do not have access to these log files, call your friendly neighbourhood systems administrator to get them for you. If you have access (or do not have a friendly neighbourhood systems administrator), then you will need to locate the files you need. Here’s how:
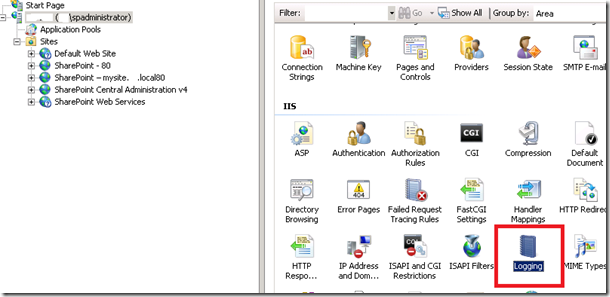
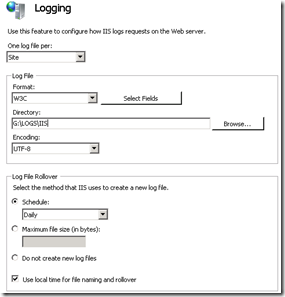
Assuming you have access to your web front end server/s, you can load Internet Information Services (IIS) Manager from Start->All programs->Administrative tools on the server. Using this tool we can find out the location of the IIS log files as well as the specific logs we need. By default IIS logs are stored in C:\inetpub\logs\LogFiles, but it is common for this location to be changed to somewhere else. To confirm this in IIS manager, click on the server name in the left pane, then click on the Logging” icon in the right pane. In the example below, we can see that the IIS logfiles live in G:\LOGS\IIS folder (I always move the logfiles off C:\ as a matter of principle). While you are there, pay special attention to the fairly nondescript “Use local time for file naming and rollover” tickbox. We are going to return to that later…
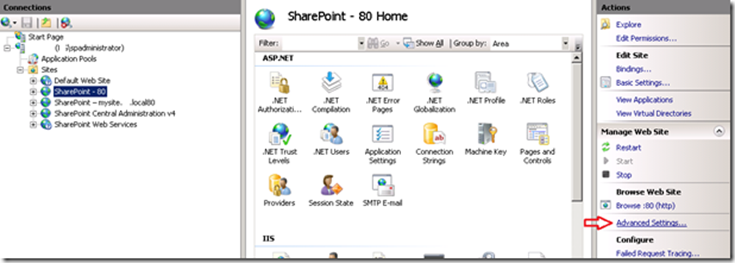
Okay so we know where the log files live, so lets work out the sub-folder for the specific site. Back in the left hand pane now, expand “Sites” and find the web site you want to profile for RPS. When you have found it, select it and find the “Advanced Settings” link and click it.
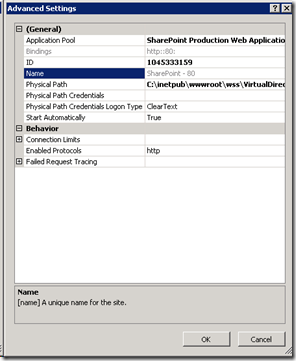
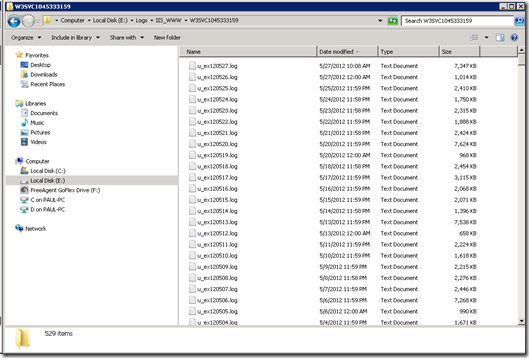
On the next screen you will see ID of the site. It will be a large number – something like 1045333159. Take a note of this ID, because all IIS logs for this site will be stored in a folder with the name “W3SVC” prepended to this ID (eg W3SVC1045333159). Thus the folder we are looking for is G:\LOGS\IIS\W3SVC1045333159. Copy the contents of this folder to the computer where you have installed logparser to. (In my example below I copied the logs to E:\LOGS\IIS_WWW\W3SVC1045333159 on a test server).
Step 3: Preparation of log files…
Okay, so now we have our log files copied to our PC, so we can start doing some log parser magic. Unfortunately default IIS logfile format does not make RPS reporting particularly easy and we have to process the raw logs to make a file that is easier to use. Now business people – stay with me here… the payoff is worth the command line pain you are about to endure! ![]()
First up, we will make use of the excellent work of Mike Wise (You can find his original document here), who created a script for log parser that processes all of the logfiles and creates a single (potentially very large) file that:
- includes a new field which is the time of the day converted into seconds
- splits the date and timestamp up into individual bits (day, month, hour, minute, etc.) This makes it easier to do consolidated reports
- excludes 401 authentication requests (way back in part 1 I noted that Microsoft excludes authentication traffic from RPS)
I have pasted a modified version of Mike’s log parser script below, but before you go and copy it into Notepad, make sure you check two really important things.
- Be sure to change the path in the second last line of the script to the folder where you copied the IIS logs to (In my case it was E:\LOGS\IIS_WWW\W3SVC1045333159\*.log)
- Check whether IIS is saving your logfiles using UTC timestamps or local timestamps. (Now you know why I told you to specifically make note of the “Use local time for file naming and rollover” tickbox earlier). If the box is unticked, the logs are in UTC time and you should use the first script pasted below. If it is ticked, the logs are in local time the second script should be used.
UTC Script
select EXTRACT_FILENAME(LogFilename),LogRow, date, time, cs-method, cs-uri-stem, cs-username,
c-ip, cs(User-Agent), cs-host, sc-status, sc-substatus, sc-bytes, cs-bytes, time-taken,

add(
    add(
         mul(3600,to_int(to_string(to_localtime(to_timestamp(date,time)),'hh'))),
         mul(60,to_int(to_string(to_localtime(to_timestamp(date,time)),'mm')))
    ),
    to_int(to_string(to_localtime(to_timestamp(date,time)),'ss'))
) as secs,

add(
    mul(60,to_int(to_string(to_localtime(to_timestamp(date,time)),'hh'))),
    to_int(to_string(to_localtime(to_timestamp(date,time)),'mm'))
) as minu,

to_int(to_string(to_localtime(to_timestamp(date,time)),'yy')) as yy,
to_int(to_string(to_localtime(to_timestamp(date,time)),'MM')) as mo,
to_int(to_string(to_localtime(to_timestamp(date,time)),'dd')) as dd,
to_int(to_string(to_localtime(to_timestamp(date,time)),'hh')) as hh,
to_int(to_string(to_localtime(to_timestamp(date,time)),'mm')) as mi,
to_int(to_string(to_localtime(to_timestamp(date,time)),'ss')) as ss,
to_lowercase(EXTRACT_PATH(cs-uri-stem)) as fpath,
to_lowercase(EXTRACT_FILENAME(cs-uri-stem)) as fname,
to_lowercase(EXTRACT_EXTENSION(cs-uri-stem)) as fext

from e:\logs\iis_www\W3SVC1045333159\*.log

where sc-status<>401 and date BETWEEN TO_TIMESTAMP(%startdate%, 'yyyy-MM-dd') and TO_TIMESTAMP(%enddate%, 'yyyy-MM-dd')
Local Time Script
select EXTRACT_FILENAME(LogFilename),LogRow, date, time, cs-method, cs-uri-stem, cs-username,
c-ip, cs(User-Agent), cs-host, sc-status, sc-substatus, sc-bytes, cs-bytes, time-taken,

add(
   add(
      mul(3600,to_int(to_string(to_timestamp(date,time),'hh'))),
      mul(60,to_int(to_string(to_timestamp(date,time),'mm')))
   ),
   to_int(to_string(to_timestamp(date,time),'ss'))
) as secs,

add(
   mul(60,to_int(to_string(to_timestamp(date,time),'hh'))),
   to_int(to_string(to_timestamp(date,time),'mm'))
) as minu,

to_int(to_string(to_timestamp(date,time),'yy')) as yy,
to_int(to_string(to_timestamp(date,time),'MM')) as mo,
to_int(to_string(to_timestamp(date,time),'dd')) as dd,
to_int(to_string(to_timestamp(date,time),'hh')) as hh,
to_int(to_string(to_timestamp(date,time),'mm')) as mi,
to_int(to_string(to_timestamp(date,time),'ss')) as ss,
to_lowercase(EXTRACT_PATH(cs-uri-stem)) as fpath,
to_lowercase(EXTRACT_FILENAME(cs-uri-stem)) as fname,
to_lowercase(EXTRACT_EXTENSION(cs-uri-stem)) as fext

from e:\logs\iis_www\W3SVC1045333159\*.log

where sc-status<>401 and date BETWEEN TO_TIMESTAMP(%startdate%, 'yyyy-MM-dd') and TO_TIMESTAMP(%enddate%, 'yyyy-MM-dd')
After choosing the appropriate script and modifying the second last line, save this file into the Log parser installation folder and call it GETSECONDS.TXT.
For the three readers who *really* want to know, the key part of what this does is to take the timestamp of each log entry and turn it into what second of the day it is and what minute of the day it is. So assuming the timestamp is 8:35am at the 34 second park, the formula effectively adds together:
- 8 * 3600 (since there are 3600 seconds in an hour)
- 35 * 60 (60 seconds in a minute)
- 34 seconds
= 30934 seconds
- 8 * 60 (60 minutes in an hour)
- 35 minutes
= 515 minutes
Now that we have our GETSECONDS.TXT script ready, let’s use Log parser to generate our file that we will use for reporting. Open a command prompt (for later versions of windows make sure it is an administrator command prompt) and change directory to the LogParser installation location.
C:\Program Files (x86)\Log Parser 2.2>
Now decide a date to report on. In my example, the logs go back two years and I only want the the 15th of November 2011. The format for the dates MUST be “yyyy-mm-dd” (e.g. 2011-11-15).
Type in the following command (substituting whatever date range interests you):
logparser -i:IISW3C file:GetSeconds.txt?startdate=’2011-11-15’+enddate=’2011-11-15′ -o:csv >e:\temp\LogWithSeconds.csv
- The –i parameter specifies the type of input file. In this case the input file is IISW3C (IIS weblog format)
- The ?startdate parameter specifies the start date you want to process
- The +enddate parameter specifies the end date you want to process
- The –o parameter specifies the type of output file. In this case the output file is CSV format
- The –q parameter says not to prompt the user for anything
- The >LogWithSeconds.csv says to save the CSV output into a file called LogsWithSeconds.csv
So depending on how many logfiles you had in your logs folder, things may take a while to process. Be patient here… after all, it might be processing years of logfiles (and now you know why we didn’t do this in a production install!). Also be warned, the resulting LogWithSeconds.csv that is created will be very very big if you specified a wide date range. Whatever you do, do not open this file with notepad if its large! We will be using additional log parser scripts to interrogate it instead.
Conclusion
Right! If you got this far and your normally not a command line kind of person… well done! If you are a developer, thanks for sticking with me. You should have a newly minted file called LogWithSeconds.csv and you are ready to do some interrogation of it. In the next post, I will outline some more logparser scripts that generate some useful information!
Until then, thanks for reading
Paul Culmsee
p.s Why not check out my completely non SharePoint book entitled “The Heretics Guide to Best Practices”. It recently won a business book award.



June 9th, 2012 at 8:57 am |
[…] the infrastructureDemystifying SharePoint Performance Management Part 2–so what is RPS anyway?Demystifying SharePoint Performance Management Part 3 – Getting at RPSDemystifying SharePoint Performance Management Part 4 – Making use of RPS Hi all. Welcome to […]
August 11th, 2012 at 12:06 am |
[…] Demystifying SharePoint Performance Management Part 3 – Getting at RPS […]
August 19th, 2012 at 10:30 am |
[…] infrastructureDemystifying SharePoint Performance Management Part 2 – So what is RPS anyway?Demystifying SharePoint Performance Management Part 3 – Getting at RPSDemystifying SharePoint Performance Management Part 4 – Making use of RPSDemystifying […]