Demystifying SharePoint Performance Management Part 4 – Making use of RPS
Hi all. Welcome to part 4 of a rapidly growing series of posts on trying to take some of the mystery out of SharePoint performance management. Essentially I am trying to write a sort of preamble to the existing Microsoft resources which are extremely comprehensive and full of wisdom, but suffer from being rather large and a lot to get through. To remind you, we have the 307 page “Planning guide for server farms and environments for Microsoft SharePoint Server 2010,” the 367 page “Capacity Planning for Microsoft SharePoint Server 2010” and the lesser known, but equally excellent 23 pages of “Analysing Microsoft SharePoint Products and Technologies Usage” whitepaper.
My hope that this series establishes just enough groundwork for someone to find the aforementioned documents an easier read and get more out of them.
Now this series is starting to turn out like the “Humble Tribute to the Leave Form” series, which I never actually finished (*blush*). Basically the number of posts to complete it exceeded the time I had available to write it (and my interest shifted to other things). For this topic of performance, I originally thought this series might be 4 posts but we are now at post 4 and haven’t actually gotten off the Requests Per Second (RPS) performance counter yet.
So let’s cracking…
Command line alert (again)
I have a tendency to have fun at the expense of IT stereotypes in my posts, and in the interests of fairness, I turned this around in part 3 I and took the piss out of the “I’m business, not technical” wusses instead. You all know who you are… you tend to shun anything that involves the command line as if it was the most complex thing ever. So continuing in that vein, if I managed not to completely scare the crap out of you in the last post, you should have the excellent log parser utility installed and have created a file called LogWithSeconds.csv. If you have not, go back and read part 3. To remind you quickly, the log parser command that we used to generate the LogWithSeconds.csv file was:
logparser -i:IISW3C file:GetSeconds.txt?startdate=’2011-11-15′+enddate=’2011-11-15′ -o:csv >LogWithSeconds.csv
The key point being that you can specify a date range for the logs you want to process.
For the rest of this article, we continue to play in the command-line playground and utilise some different logparser scripts to derive some useful information. In addition, we will utilise a bit of PowerShell, as well as check out another great free utility written by Nikander & Margriet Bruggeman (more on that later).
Also at this point I need to call out and credit the excellent work of Mike Wise. His aforementioned 2009 whitepaper called“Analysing Microsoft SharePoint Products and Technologies Usage” is the basis for what I cover here. I urge you to download and read this article as it goes into more detail on Log Parser and its uses beyond just RPS alone. Although I have based my stuff off Mike’s work, there are some differences that you will see as we progress through this article.
Distribution of RPS
The one thing that past examination of RPS can give you is a distribution of requests over time. Understanding the distribution (or shape of RPS) helps you to identify patterns to SharePoint use, such as peak or heavy usage times. To that end, the first log parser script will generate a CSV file that can be imported into a tool like excel to chart the distribution of RPS. The log parser script below has been modified from one in Mike’s document, because he assumes you are only looking at 24 hours of log data. In my case, I assume that you might want to profile more than 24 hours (essentially the date range specified in the log parser command above).
The command to generate a per-second RPS distribution is below. The only difference between my script and the one Mike did is I added the “date” field to the SQL to account for multiple days:
logparser -i:CSV -o:CSV “select count(*) as ct,date as Date, secs,max(hh) as hh,max(mi) as mi,max(ss) as ss from e:\temp\LogWithSeconds.csv group by date,secs order by date, secs” -q >RPSDistribution.csv
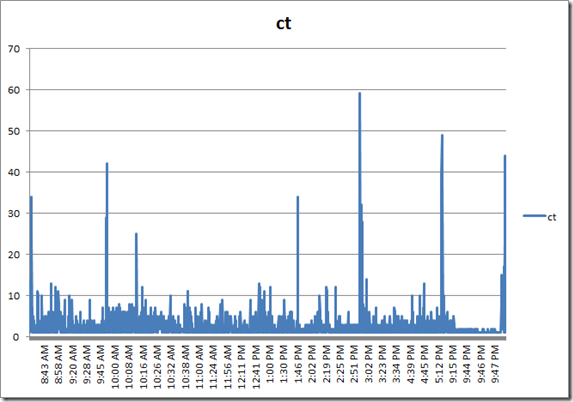
This command will create a new CSV file called RPSDistribution.CSV that contains the count of requests at any given second during the specified date range. So let’s open RPSDistribution.CSV into Excel and create a chart (I assume you know how to do that). Here is what it looks like…
Now I wonder if you can spot the issue with this chart? If you look closely, note that the times are not evenly spaced. This occurs because the generated file (RPSDistribution.CSV) only contains entries for the seconds during the day where there were requests. If no requests were made, then nothing was recorded. This skews the graph because if we want to see the distribution of requests, we also need to know the seconds of the day where there were zero requests. The graph you see above has effectively squeezed out all of the quiet times.
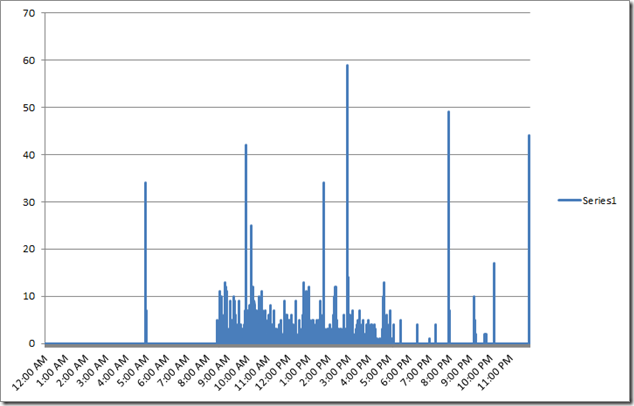
To work around this issue, I wrote the following PowerShell script. For you non-programmers, I am not going to explain all of the gory logic of this script, but just be assured that it adds entries stating zero RPS for every second of the day where there were no requests made. This will normalise the data across time and make a much more meaningful graph.
(If this is starting to hurt your brain, stick with me… paste the code below into notepad, save it in the Log parser installation folder and call it AddNulsPerSec.ps1)
param([string]$inputcsv, [string]$outputcsv = "output.csv")
if (!$inputcsv) {
    write-host "The -inputcsv parameter has not been specified. Script cannot run without it";
    exit;
}
if (Test-Path -path $outputcsv) { remove-item $outputcsv }
$x = 0;
$y = import-csv $inputcsv
write-output "ct,date,secs,minu,hh,mm,ss" | add-content -path $outputcsv
$y | foreach {
    if ($x -gt 86399) { $x = 0 }
    $s = [int]$_.secs;
    while ($s -gt $x) {
        $d = [datetime]$_.date;
        $d=$d.AddSeconds($x)
        $ss = $d.tostring("ss")
        $mm = $d.tostring("mm")
        $hh = $d.tostring("HH")
        $minu = [int]$hh * 60 + [int]$mm
        $output = "0" + "," + $_.Date + "," + $x + "," + $minu + "," + $ss + "," + $mm + "," + $hh
        write-output $output
        $x++;
   }
   $output = $_.ct + "," + $_.Date + "," + $_.secs + "," + $_.minu + "," + $_.ss + "," + $_.mi + "," + $_.hh
   write-output $output
   $x++;
} | add-content -path $outputcsv
The above script takes two command-line parameters: inputCSV and outputCSV. inputCSV is the file name to process and outputCSV is the resulting file with the 0 RPS entries added. Note that to run this script you will need to use a PowerShell window, rather than a command prompt. Below is the command I used:
PS C:\Program Files (x86)\Log Parser 2.2> .\AddNulsPerSec.ps1 -inputcsv RPSDistribution.CSV -outputcsv RPSDistributionNormalised.CSV
This created the file RPSDistributionNormalised.CSV. I charted this file in Excel and we now have a time-normalised distribution. Take a look at the X axis. This looks more logical now as the times are more evenly spaced. It seems from looking at this, that peak times are between 10am-11am, although one could argue that a lot of the day was fairly busy, with a bit of a lull between 2 and 3pm.
So what else can we do?
Right, so apart from the utility of being able to get a sense of when there are a lot of requests versus quiet times, can we find out anything else useful? Much insight can be gleaned from Mike Wise’s document, so here I will cover a couple of things specific to RPS.
RPS distribution for certain users
Let’s go back to the LogWithSeconds.CSV we started with and find out the top users for the period being examined. In the log parser command below we are grouping users by total requests they made, ordering from largest to smallest..
logparser -i:csv “select top 20 count(*) as ct,cs-username as user from LogWithSeconds.csv group by user order by ct desc”
A snippett of the output from this command is below:
ct  user
--- --------------------
840 DOMAIN\Jame.Smith
688 DOMAIN\searchcrawler
614 DOMAIN\Ian.Jones
508 DOMAIN\Steve.Hill
357 DOMAIN\Ant.Cough
313 DOMAIN\dom.davies
260 DOMAIN\matthew.martin
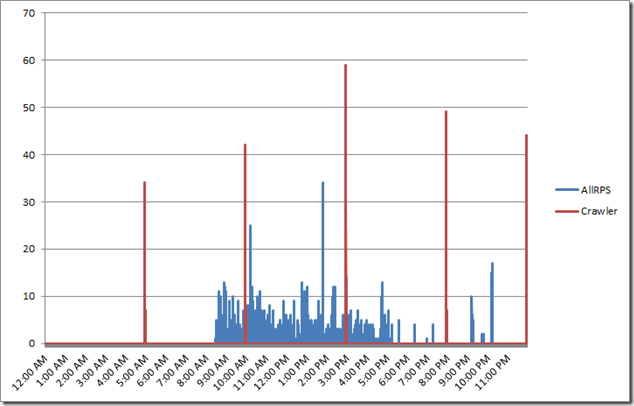
Hmm, I notice that the search crawler account (DOMAIN\searchcrawler) was busy during that day. It appears to have made the second largest number of requests. How about we work out when the search crawler was active by filtering the requests just for this user. Perhaps search crawls are active during peak times and introducing unnecessary load on the server?
First up, lets create the RPS distribution, but this time just for the search crawler account (note the SQL WHERE clause in the command below)
logparser -i:CSV -o:CSV “select count(*) as ct,date as Date, secs,max(hh) as hh,max(mi) as mi,max(ss) as ss,cs-username as user from LogWithSeconds.csv where user=’DOMAIN\searchcrawler’ group by user, date,secs order by date, secs” -q>crawler.csv
Now we need to pad CRAWLER.CSV out with 0 entries to time-normalise it for the seconds in which it wasn’t active… back to my PowerShell script…
PS C:\Program Files (x86)\Log Parser 2.2> .\AddNulsPerSec.ps1 -inputcsv crawler.csv -outputcsv CrawlerNormalised.csv
I then took the results from CrawlerNormalised.csv and added them to my previous RPS distribution chart in Excel. Straight away you can see the incremental crawl schedule of this SharePoint installation is 5 hourly. (Note the red lines at regular intervals)
RPS Distribution for certain clients…
Another use for RPS is to see the pattern of the various applications that interact with SharePoint. Aside from the trusty old browser, we also have Office clients, Windows Explorer, SharePoint Workspace, and 3rd party tools like SharePlus. All of these applications identify themselves to SharePoint via the use of something called the user-agent [stored in the LogWithSeconds.CSV file in a column called cs(user-agent)]. The user agent field is actually part of the HTTP standard and not SharePoint specific, but let’s take advantage of it…
logparser -i:CSV “select count(*) as ct,cs(user-agent) from LogWithSeconds.CSV group by cs(user-agent) order by ct desc” -q >BrowserList.csv
Now, I am not going to paste the complete output of running this command because unfortunately, browsers have a lot of variation in their user agent string. Nevertheless, here are some of results from the BrowserList.csv file…
867 Mozilla/4.0+(compatible;+MSIE+7.0;+Windows+NT+5.1;+Trident/4.0;+.NET+CLR+1.1.4322;+.NET+CLR+2.0.50727;+.NET+CLR+3.0.04506.30;+.NET+CLR+3.0.04506.648;+.NET+CLR+3.0.4506.2152;+.NET+CLR+3.5.30729;+yie8)
688 Mozilla/4.0+(compatible;+MSIE+4.01;+Windows+NT;+MS+Search+6.0+Robot)
386 harmon.ie+for+Notes
333 Mozilla/5.0+(Windows;+U;+Windows+NT+6.1;+en-US;+rv:1.9.2.24)+Gecko/20111103+Firefox/3.6.24
250 SharePlus+2.9.5+(iPad;+iPhone+OS+4.2.1;+en_AU)
99  MSFrontPage/12.0
95  Mainsoft+SharePoint+Integrator
68  Microsoft+Office/14.0+(Windows+NT+6.1;+OWSSUPP+14.0.6112;+Pro)
34  Microsoft-WebDAV-MiniRedir/6.1.7600
24  Microsoft+Office+Outlook+2010+(14.0.6112)+Windows+NT+6.1
23  Microsoft+Office+Sharepoint+Workspace+2010+(14.0.6112)+Windows+NT+6.1
4   MobileSafari/7534.48.3+CFNetwork/548.0.3+Darwin/11.0.0
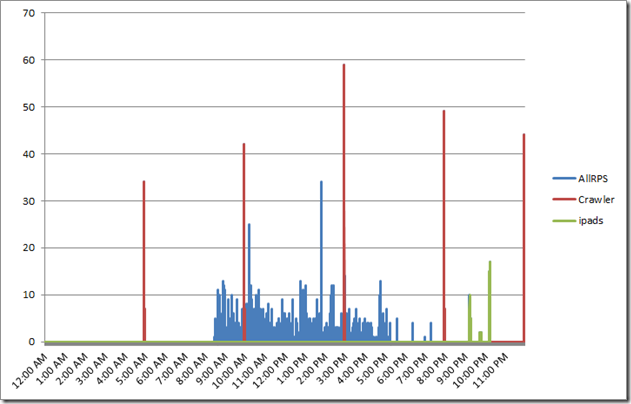
Now looking at these strings, it doesn’t take long to get a sense of the different ways SharePoint has been accessed. How about we generate a distribution of RPS for all iPad devices or apps? Here’s the log parser command along with my time normaliser script.
logparser -i:CSV -o:CSV “select count(*) as ct,date as Date, secs,max(hh) as hh,max(mi) as mi,max(ss) as ss,cs(User-Agent) as ua from LogWithSeconds.CSV where ua like ‘%iPad%’ group by ua, date,secs order by date, secs”-q >iPads.csv
.\AddNulsPerSec.ps1 -inputcsv E:\temp\ipads.csv -outputcsv e:\temp\iPadNormalised.csv
… and the result when added into Excel? iPads were definitely the evening tool of choice that day! Note the green spikes around 9-10pm.
Taking it further…
I won’t do much more on RPS now. Hopefully I have given you enough to do much more clever things than I have covered. As I stated in part 2, the nice thing about RPS is that it can be derived from web server logs and these tend to go back quite far in time. Given that the core sequence of events to produce the graphs above are essentially 3 scripts and can be done quickly, it becomes quite easy to sample different points in history. For example: Let’s say that we want to compare the 15th of November 2011 with the 10th of March 2012 to see whether there is an increase/decrease in requests and what this looks like. All we have to do is change the date, re-run the scripts and do some charting magic.
- logparser -i:IISW3C file:GetSeconds.txt?startdate=’2012-3-10′+enddate=’2012-3-10′ -o:csv >LogWithSeconds.csv
- logparser -i:CSV -o:CSV “select count(*) as ct,date as Date, secs,max(hh) as hh,max(mi) as mi,max(ss) as ss from LogWithSeconds.csv group by date,secs order by date, secs” -q >RPSDistribution.csv
- AddNulsPerSec.ps1 -inputcsv RPSDistribution.CSV -outputcsv RPSDistributionNormalised.CSV
We can look at the distribution for an entire week is we wanted to…
- logparser -i:IISW3C file:GetSeconds.txt?startdate=’2012-5-7′+enddate=’2011-5-11′ -o:csv >LogWithSeconds.csv
- logparser -i:CSV -o:CSV “select count(*) as ct,date as Date, secs,max(hh) as hh,max(mi) as mi,max(ss) as ss from LogWithSeconds.csv group by date,secs order by date, secs” -q >RPSDistribution.csv
- AddNulsPerSec.ps1 -inputcsv RPSDistribution.CSV -outputcsv RPSDistributionNormalised.CSV
Also in case you didn’t notice in part 3, my GetSeconds.txt logparser script that performs the initial processing of the IIS logfiles, also stores the minute of the day, as well as seconds of the day. This allows you to perform all of the same things I have specified in this article except it can be Requests Per Minute (RPM) instead. This would allow you to work with a larger date range without such big files (provided RPM is appropriate for what you want). Consult the “Analysing Microsoft SharePoint Products and Technologies Usage” whitepaper for more information on logparser queries for RPM scenarios.
Remember that the virtues of your web server logs go much further than RPS. We saw a hint of this in my examples of showing RPS for just one user or one device type. But this really is just scratching the surface of what can be gleaned via logparser. There are many excellent logparser scripts around, and a quick google search should give you plenty of examples.
Also remember that there are many more sophisticated ways to process this sort of data. For example, putting it into Analysis Services and slicing/dicing it via PowerPivot, or using something like RRDTool. To that end, I would also be seriously remiss if I did not make you aware of the SharePoint Flavored Weblog Reader tool. It was created by Nikander & Margriet Bruggeman who run the SharePoint Dragons blog – probably the best SharePoint performance related blog out there. This tool was specifically designed to make it easier to analyse IIS logs for SharePoint specific information. It is a command line tool, but much simpler and slicker than the methods I introduced in this post. Instead of specifying a date range you specify the number of items from the logs to process. For example:
sfwr.exe 250,000 “E:\LOGS\IIS_WWW\W3SVC1045333159”
Here are some of the things it reports on for you straight out of the box:
- Most busy days of the week, most requested pages and requested pages per day.
- The average, max and min request times per URI, InfoPath URI and Report Server URI.
- Browser percentages, dead links, failed pages, percentage of error page requests.
- Requests per hour per day, requests per hour, requests per user (also per week and month)
- Slowest requests, top requests per hour, top visitors.
- Traffic per day and per week in MB.
- Unique visitors per day, week and month
Reflections…
At the end of the day, while examining the pattern of RPS can be very handy in offering insights into how your web application (SharePoint or otherwise) performs, as a lead indicator it is always going to be fairly wishy washy. As soon as you turn your attention to the future, many variables come into play that you cannot predict as accurately as you’d like. Your existing webserver logs can offer you a lot of ways to help make a more informed prediction, but at the end of the day, one has to take into account the new unique features of SharePoint 2010, how they will be used and so forth.
I will be returning to this theme, once we examine some other performance indicators, but hopefully at this point, you might find some aspects of Microsoft’s Capacity planning for Microsoft SharePoint Server 2010 guide less intimidating. Page 43 in particular has some great material that builds upon what we cover here. To quote Microsoft…
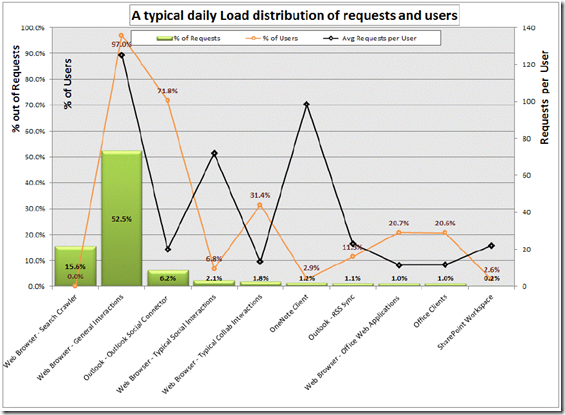
Understanding the distribution of the requests based on the clients applications that are interacting with the farm can help predict the expected trend and load changes after migrating to SharePoint Server 2010. As users transition to more recent client versions such as Office 2010, and start using the new capabilities new load patterns, RPS and total requests are expected to grow
I will leave you with a terrific example a graph that Microsoft created using IIS logs (on page 44 of the aforementioned document). This is a view of a typical day in an internal Microsoft environment serving what is deemed “a typical social solution”. It shows just how much additional load a new feature can introduce (in this case, Outlook Social Connector feature is 6.2% of the total number requests). The combination of different clients on the X axis, with the % distribution of overall and per-user requests on the Y axis is really handy.
Coming up next…
At this point I think we have covered RPS sufficiently, and dovetailed in nicely to Microsoft documentation – particularly pages 41-47 of the SharePoint 2010 Capacity Planning Guide. Our next stop will be looking at another much misunderstood lead indicator for performance – disk IO and latency. Once again I will introduce you to a couple of useful tools and offer you what I think is the best way to approach disk performance requirements that will make life easier for you and your storage people.
Until then, thanks for reading…
Paul Culmsee



June 13th, 2012 at 3:09 pm |
[…] well written, entertaining, and very informational: http://www.cleverworkarounds.com/2012/06/09/demystifying-sharepoint-performance-management-part-4mak… (check out the other parts as well). We liked it so much that we’ve added it to the SharePoint […]
July 31st, 2012 at 8:19 pm |
[…] So what is RPS anyway?Demystifying SharePoint Performance Management Part 3 – Getting at RPSDemystifying SharePoint Performance Management Part 4 – Making use of RPSDemystifying SharePoint Performance Management Part 5 – So what is latency anyway?Demystifying […]
August 26th, 2012 at 4:48 pm |
[…] So what is RPS anyway?Demystifying SharePoint Performance Management Part 3 – Getting at RPSDemystifying SharePoint Performance Management Part 4 – Making use of RPSDemystifying SharePoint Performance Management Part 5 – So what is latency anyway?Demystifying […]
September 1st, 2012 at 1:18 am |
Can you please provide the instructions for graphing this data? I am having major issues trying to get the data to chat like you have it.