Disk and I/O Sizing for MOSS2007 – Part 1
This two part article discusses techniques for sizing your disk requirements for SharePoint. It is one of a myriad of tasks that you have to perform as part of the planning process, but it is one task that you ideally want to get right the first time, as storage technology can be a potentially high capital cost. I first performed a comprehensive analysis of disk space and performance scalability requirements for a MOSS07 farm back in February 07, and at this time, apart from “Yoda Joel“, there was not much out there in relation to planning for SharePoint (particularly in relation to disk sizing). For the record, Joel is *the* ultimate SharePoint all rounder – his blog is essential reading for any SharePoint professional – magnificent stuff. “Give me a ‘J’, give me an ‘O’, give me a”… okay, now that’s definitely getting kinda weird 🙂
Anyway, this post outlines my SharePoint sizing methodology that I employed at that time. What I found personally satisfying about this work, was that when I re-examined this particular farm some months later, the sizing was bang on the money.
So as I mentioned, a lot more material exists now than then, but the information that I did find useful at the time is listed below (it may have been refreshed since I used it):
- Plan for performance and capacity (Office SharePoint Server) http://technet2.microsoft.com/Office/en-us/library/eb2493e8-e498-462a-ab5d-1b779529dc471033.mspx
- SQL Server 2005 on the IBM @eserver xSeries 460 Enterprise Server http://www.redbooks.ibm.com/redpapers/pdfs/redp4093.pdf
- Server Sizing Recommendations for SQL Server 2005. http://support.microsoft.com/servicedesks/webcasts/seminar/shared/asp/view.asp?url=/servicedesks/webcasts/en/wc011906/manifest.xml&WMPVer=10.0.0.4036
- Planning for Office SharePoint Server 2007, Part 2. http://office.microsoft.com/download/afile.aspx?AssetID=AM101638551033
So here is how I went about disk performance and growth sizing…
The requirements
This client was interested in SharePoint for collaborative document management. They had many projects with teams from 2-100 staff involved. So much of what existed on file servers was to be moved to a SharePoint environment. The growth rate of this company was significant – from 300-1110 staff in less than two years. Hence, as typically happens with such growth, the existing infrastructure, architecture and processed did not cope well with the new scale.
They used a fair amount of files on the existing file server, in the region of 1.2 terabytes. That figure alone is enough to require significant planning across a whole diverse range of SharePoint areas, not just disk space, (I will eventually get around to writing some articles covering these areas as well.). But in additon to the large amount of files on the file server, we had run a pilot SharePoint site for a single smallish project for 2 months prior.
The current regime
So since SharePoint was going to obviously use a lot of document libraries, I initially needed a point of reference to determine the current organic growth in disk space and I/O performance. The Head office had 600 staff, and two other major regional offices had a large number of staff. I needed to monitor disk usage over time, but as well, I needed estimates on what disk size was in the past.
Using this information, I would be able to interpolate future growth.
So first I talked to the HR department and key management staff to find out the following information for each of the offices:
- Current staff numbers
- Estimated staff numbers in 2 years
- Average growth rate in staff over the last 2 years
From this I derived an annual growth rate in staff numbers per office.
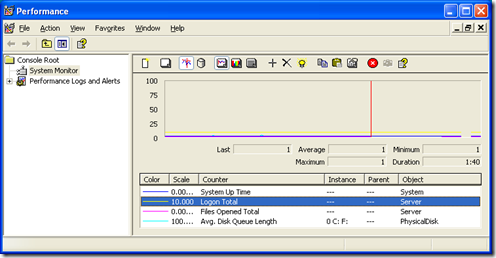
The next step was to examine the current file server performance for each office. This was performed via windows performance monitor (perfmon) and examining specific performance monitor counters. Below are the initial statistics I recorded:
- System Uptime
- Total Logons since reboot
- Logins per minute (total logons / system uptime / 60)
- Total Opened Files since reboot
- Files opened per minute Total Opened Files since reboot / system uptime / 60
- Average Disk Queue length
The specific performance monitor counters are:
- System\System Up Time
- Server\Logon Total
- Server\Files Opened Total
- PhysicalDisk\Avg. Disk Queue Length
Estimating Disk I/O and Growth Requirements
Now it is important to mention here that you cannot take these counters at face value! You need to perform more analysis against these results. For example:
- The bulk of user data activity happens during office hours to the ‘per hour’ figures need to be further refined.
- These figures do not break down the type of I/O. So for example, there still exists lame applications who’s idea of multi-user is to run the application from a shared network drive on the server. Such desktop applications running from the server it have the potential to seriously skew your results as there can be a considerable amount of I/O here.
- Backups will also potentially affect these figures and you should monitor the affect on the above counters that a backup will have on the overall numbers.
- SharePoint may only be scoped to replace a particular set of files on the server, yet the file count counters show ALL files. You cannot break it down.
So one has to take these overall figures and eventually apply a weighting, which adjust the values to the estimated portion that is relevant to SharePoint. How that weighting is determined is one of the key requirements of a disk analysis methodology.
Now having said that, you could do this via an educated guess, by talking to administration staff to determine a figure, but it would be what project managers call a ‘plus or minus’ 40% estimate. Such estimates are usually termed ‘preliminary estimate’. If this is acceptable, then go with it, since gleaning more accurate information is a time vs. results tradeoff. (I mean hey, if you are a mining company in Perth right now, this is all small change)
But, if you are accountable for the results of this test and you want to cover your butt, then look more into it 🙂 Try and come up with a plus or minus 10% estimate and document how you came up with the figure.
So below are some of the techniques you can use to dig further.
Backup Logs
Examining past backup logs will allow you to infer many things such as:
- Disk throughput (examine how long the backup took to run versus the amount backed up)
- The total amount of data backed up
- The number of files backed up.
More importantly, allows you to get some idea of the organic disk growth over time, if you can view backup reports from say, 1 year ago to now, then it should paint a reasonable picture.
Always make sure that you are only examining the weekly full backup, not the daily incremental or differential backups. It is not uncommon for some data considered of less importance to be only backed up less frequently, so this should be checked also. But my logic here is unless someone has screwed up big time, you can have reasonable confidence that the figures you get from this are based on the actual important data.
Pilot SharePoint
Running a limited pilot SharePoint production site can be an excellent microcosm of what the eventual full scale production environment will be like. I’ll save the comprehensive article on a pilot installation later. But ideally you limit the pilot scope and affected staff, but still use it in production during this time. It becomes a critical environment to support of course, but the benefit here is it impacts on less staff, allows IT technical and operational personnel to learn the product and starts the ball rolling on governance and other critical issues that need to be addressed. The added bonus is that it allows you to compare what ‘regular’ organic disk space growth is in your environment, to the equivalent growth is when the data is instead in SharePoint. Remember, SharePoint document libraries offer some tremendous productivity enhancements such as version control, indexing and recycle bin affecting space. Later in this article, you will see how I went about estimating disk growth by using a pilot site.
Logical Disk counters
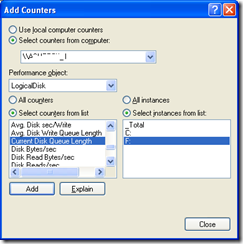
If the administrators of the file server have been clever, they would have split data across different disks or partitions for performance and managability reasons. It is possible to infer from this, the breakdown of file I/O by examining disk performance counters that are collected on a per-partition/disk basis. The best performance monitor counters are the LogicalDisk category, since you can have multiple logical partitions on a single physical disk. Note below I can choose C:\ or F:\ to view the current disk queue length
I remember years back that Microsoft considered anything over 2 to indicate a disk under load. Yoda Joel suggests that the figure should stay over 1. I would advise you to heed his advice – Yodas always know best – they are jedi after all!
Computer Management – Shared Files
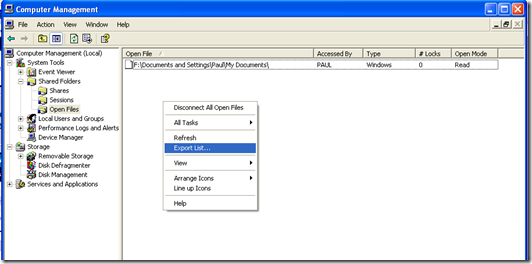
Whilst the previous method is useful for I/O performance, its not granular in terms of file breakdown. Examining the open files in the “Computer Management” MMC also will allow you to perform more detailed analysis. Unfortunately, exporting this data leaves something to be desired and you can only grab the data by right clicking in this window and choosing “Export List”
This will generate a tab delimited text file that can be loaded into Excel for further analysis. The columns reported are:
| Open File | Lists the names of open files. An open file could be a file, a named pipe, a print job in a print spooler, or a resource of an unrecognized type. In some cases, a print job is shown here as an open named pipe |
| Accessed By | The name of the user who has opened the file or accessed the resource |
| Type | Displays the type of network connection: Windows, NetWare, or Macintosh |
| # Locks | Displays the number of application-initiated file locks on the resource |
| Open Mode | Displays the permission that was granted when the resource was opened |
Knowing the user that opened the file is very handy as it allows for some other statistics to be inferred.
Other Methods
Unlike my series of articles on branding, I am not going to write an epic 6 part article on performance capturing. But a few other techniques that may be applicable to you depends on the technology and vendor you have. If the servers are SAN connected, you can almost certainly capture detailed disk I/O stats via its management console and likely, SNMP.
A Basic Example
Below is an example of a basic determination of current disk activity with an initial attempt at weighting the numbers.
MYSERVER stats taken 10am – 30/1/2007
- System Uptime: 551 hours
- Total Logons since reboot: 927794
- Logons per minute – 927794 / (551 * 60): 28
- Total Opened Files since reboot: 114518692
- Files opened per minute – 114518692 / (551 * 60) : 3463
- Average Disk Queue length: 2-4
Clearly, on the surface of it, this is a heavily utilized server and before we even think of moving to SharePoint, these figures alone indicate that more analysis is needed. Note that the period in which these statistics were gathered was 10am which is considered a peak time.
MYSERVER is used for shared applications as well as shared files. Luckily all shared applications are stored on E:\APPS.
Here is the breakdown
- Reported open files in computer management: 1206
- Number of unique users listed with opened files: 201
- Number of open files for E:\APPS: 664
- Number remaining not E:\APPS: 542
- % of open files to DATA shares: 45%
- Of non E:\APPS, number of open files (as opposed to folder): 314
- % of open files versus active listed files (314/1206): 26%
So now we have an idea of the sort of initial weighting to use. At this point, you can move to part 2 of this topic to see how we took these figures and determined both disk I/O throughput as well as disk space sizing
thanks for reading


0 Comments on “Disk and I/O Sizing for MOSS2007 – Part 1”