Learn to talk to your CFO : Collaboration scenario – Part 3
Hi. This is the third article in a series that attempts to explain some financial analysis techniques to non financial oriented IT people. My first two articles in this series were theory and background and this is the first of three scenarios that illustrates an example.
This first scenario is an example of SharePoint as a collaborative solution. It also happens to be the scenario that for my money, carries with it the most risk. But at the same time, SharePoint is well suited to this sort of solution if you follow my branding and document management wisdom 🙂
Please Note: This is a very, very simplistic scenario and is in no way comprehensive. It is not designed purely as a guide only! Please do not take it as gospel! Make sure you read my assumptions!
Now I have to make a big warning here! This is a bit of a dry read unfortunately. Its kind of hard to make accounting into a funny and entertaining read. Maybe that explains why accountants never laugh at my jokes! So .. go and get a real BIG coffee mug with an extra shot ok? Just remember this: These sorts of feasability study type documents tend to be 50-100 pages and companies charge lots and lots for them! This is a very simple version.
CleverWorkArounds Coffee requirement rating:  🙂
🙂
The problem
With 1000 staff, and several offices around the world, our sample organisation is seriously struggling with their current set-up. Despite using the latest MS Office suite, users can’t ‘find stuff’ and don’t know where to ‘put stuff’. Each office has its own file server with a shared network drive, however the folder structure is large, complex, out of date and unwieldy.
There is a file naming convention, but no-one knows it. People put stuff into the wrong folders. Files are forever being deleted or overwritten. Users store documents on their home PC’s or their email. There are departmental squabbles when changes are made without consultation. Multiple copies of documents abound, and no-one is quite sure whether they are working with the latest version. There are complaints that there is a lack of process, although processes are defined, however not followed because they are unenforceable and not communicated well.
The above problems are more acute with the remote offices due to communications constraints, limited support and infrastructure and as a result, over time those teams in the remote offices have started to do things their own way.
Technical support costs are high, with 30% of all helpdesk calls being for permission/filesystem issues. Daily restoration from backups takes the human equivalent of a full time support team member.
Sharing and working on files between different offices is non existent. Currently the idea of collaboration is the corporate email system.
Gee, I bet some of you are thinking.. that *does* sound familiar! 😛
The business drivers
The larger the company grows, the more these problems are exacerbated. The company wants to improve internal efficiency by reducing the sort of time wasting problems described above. On top of that, the company wants to leverage the human assets it has in its remote offices so that work can be better shared where the skills lie. Head office costs are significantly more than the regional offices. So if work can be farmed out to these offices, there are significant cost savings to be had.
The analysis
This example assumes that a limited pilot has been conducted and for simplicity reasons, assumes that we are rolling out a central SharePoint farm at head office to be accessed by the remote sites. So let’s estimate the cost to implementing this scenario by following the governance checklist as described in my previous post.
If you are interested in the numbers only, and don’t care about how I went about determining them, then you can skip this section and go straight to the next section titled “Complete 3 Years Cost”.
Information Architecture
For a collaborative, document oriented project, information architecture is one of the complex project tasks to be performed. This is because each department in the organisation will have to be profiled or workshopped to identify sites, workspaces, content types, libraries, columns, workflow and search. For an organisation of this size and a project of this scope, we will engage an information architecture professional as suggested by Microsoft’s governance checklist. Working with key internal staff several key tasks will be performed. Wire-frames will be built for the most popular pages. A site-map to plan the overall structure will be developed, then expanded out to lower-level sites and sections. Finally, the information architecture professional will perform the most complex task of identifying and building content types for departments and regions.
The cost to develop the information architecture for such an organisation is estimated to be a 30 man-day engagement for an external consultant and ongoing review is 10 man days for an external consultant (don’t forget out 25/75 assumption so internal staff are 3 times the external staff)
| Item | Cost Estimate |
| Year 1: 30 man-day information architecture engagement (external consultant) 8 * 30 * 150 | $36,000 |
| Year 1: 90 man-day information architecture engagement (internal staff) 8 * 30 * 100 |
$72,000 |
| Ongoing 10 day information architecture engagement (8 * 10 * 150) | $12,000 |
| Ongoing 30 day information architecture engagement (8 * 30 * 100) | $24,500 |
| Total (Initial) | $108,000 |
| Total (Per Year) | $36,000 |
Project and Operational Management
Project Management, Project Communication, Deployment Process, Governance Tasks and SLA.
For a collaborative, document oriented project, a communications plan is absolutely critical. Unlike say, WCM, you are impacting your entire workforce with a new way of thinking and a new way of operating. Undertakings of this scale tend to be branded within an “organisational change” framework that has its own budget. Governance tasks such as change control and deployment processes need to be finalised, as well as the establishment of a Governance committee to review these controls as well as obtain service level agreements from the business and set up support/helpdesk arrangements.
The cost to develop the project and operational management for such an organisation is estimated to be a 20 day engagement for an external consultant:
| Item | Cost Estimate |
| 20 man-day project and operational management (external consultant) 8 * 20 * 150 |
$24,000 |
| 30 man-day project and operational management (internal staff) 8 * 60 * 100 |
$48,000 |
| 90 day End-to-end project management costs (internal staff) | $72,000 |
| Total | $144,000 |
Development and Configuration
In this category, we are talking about custom development and branding. We need to define and communicate allowed customization tools, define site definitions, templates and the policies governing their creation. Source code and build control, documentation standards and development security requirements.
Branding is a big risk issue here, as I have spent much time talking about it. I am going to assume that sanity prevails here and branding is not a major consideration.
This category can be handled by internal resources. The cost to develop the development and configuration guidelines for such an organisation is estimated to be a 20 man days
| Item | Cost Estimate |
| 15 man-day development and configuration (internal staff) 8 * 20 * 100 |
$16,000 |
| Total | $16,000 |
Infrastructure
Now we hit a big section, but unfortunately I can’t cover it without making this section too large. So here is the ultra brief version. Given this is a collaborative scenario, it is generally internal facing so we won’t concern ourselves with firewalls, reverse proxy, extranet, etc.
Given that we are talking about a high value part of the business that affects all staff (file sharing), we are going to use clustered SQL servers and SAN Storage. The web front end servers won’t be load balanced initially, as the SQL server redundancy is considered more important. So we will have a WFE for user access to the collaborative solution and one WFE server for the index/query role. In Year 3, we will add a new WFE server and load balance with the first WFE server.
We are assuming that the SAN already exists, but we have added additional disk capacity to it, to accommodate expected disk growth after performing a Disk IO and growth analysis. Disk will be assumed to upgraded again in year 3.
The current backup infrastructure was deemed to be incapable of handling the additional requirements of SharePoint and a project was undertaken to replace it. 40% of this cost has been apportioned to SharePoint as other IT assets will make use of this infrastructure also.
License costs as mentioned in article 2 were derived from Microsoft’s License Advisor site, but bear in mind their own disclaimer that it is for informational purposes only.
Internal staff costs now grow from the original 75/25% ratio to 80/20% in relation to external work.
| Item | Cost Estimate |
| 2 Uber SQL Servers (SQL Cluster) | $40,000 |
| 2 Web Front End Servers | $12,000 |
| 1 Web Front End Server (Year 3) | $6,000 |
| Network Load Balancing technology (Year 3) | $7,000 |
| SAN capacity upgrades | $25,000 |
| SAN capacity upgrades (Year 3) | $25,000 |
| Backup Upgrade (40% of total project costs) | $15,000 |
| License costs SharePoint, SQL, Windows, CAL’s (annualised over 3 years) | $120,000 |
| Hardware Maintenance (20% per annum) | $15,000 |
| 15 man-day infrastructure staff costs (external consultants) 8 * 15 * 150 |
$18,000 |
| 60 man-day infrastructure staff costs (internal staff) 8 * 60 * 100 |
$48,000 |
| Total (Initial) | $278,000 |
| Total (Year 1) | $135,000 |
| Total (Year 2) | $135,000 |
| Total (Year 3) | $46,000 |
I know the above table is woefully incomplete but remember this is about finance calculations, not scenario accuracy!
Testing and Provisioning
In this governance category, we are concerned with sorting out testing for security, stability and user acceptance. We need to identify test groups, create test plans testing and allow time and resource to respond to issues raised. For provisioning, we determine the approval process for information policies such as expiration, compliance and auditing, then document user policies and rights policies for securing restricted areas.
| Item | Cost Estimate |
| 5 man-day testing and provisioning engagement (external consultant) 8 * 5 * 150 |
$6,000 |
| 5 man-day testing and provisioning engagement (internal staff) 8 * 20 * 100 |
$16,000 |
| Total | $22,000 |
Operational Concerns
This is a very important governance section, and the amount of time and effort spent here should reflect the size, scope and eventual company dependence on this project. Monitoring of all components must be established, such as the network, SAN, servers, SQL and SharePoint. ITIL oriented administrative functions such as change and service response procedures need to be defined and signed off. Disaster recovery plan, backup methodologies, recovery testing must be completed and signed off. Operation costs are annual costs however for simplicity we will just record as up-front costs.
| Item | Cost Estimate |
| 15 man-day completing operational governance tasks (external consultant) 8 * 15 * 150 |
$18,000 |
| 60 man-day completing operational governance tasks (internal staff) 8 * 60 * 100 |
$48,000 |
| Total | $66,000 |
Education and Training
This is another governance area that will incur more cost in this scenario that others, by virtue of the fact that the majority of staff will be impacted. In addition, collaborative functionality is a more complex area than web content management.
Training content and materials need to be acquired for users, administrators, help desk and developers. The logistics of providing training for a large staff base needs to be considered.
Training costs will include a figure for lost productivity based on the payroll assumption specified in part 2 ($75,000 per annum per staff member, broken down to per hour cost of $42 from 220 working days a year)
In addition, a rollout such as this would be staged over a period of time. In our model, we will assume that 50% of staff are trained in year 1, and 50% in year 2. Ongoing training in year 3 is 20% of the year 1 and 2 costs.
| Item | Cost Estimate |
| 20 man days of the development of training course and materials (internal staff) | $16,000 |
| Half day training for 1000 staff (lost productivity of 4 hours) – Year 1 42 * 4 * 1000 |
$84,000 |
| Half day training for 1000 staff (lost productivity of 4 hours) – Year 2 42 * 4 * 1000 |
$84,000 |
| Additional Training – Year 3 | $33,000 |
| Total (Initial) | $16,000 |
| Total (Year 1) | $84,000 |
| Total (Year 2) | $84,000 |
| Total (Year 3) | $33,000 |
Complete 3 years cost
This is probably enough (otherwise will we ever get to the financial calculations? :-).
Let’s total up the costs for years 0 to 3
Initial Costs: 108,000 + 144,000 + 16,000 + 278,000 + 22,000 + 66,000 + 16,000 = $650,000
Year 1: 36,000 + 135,000 + 84,000 = $255,000
Year 2: 36,000 + 135,000 + 84,000 = $255,000
Year 3: 36,000 + 46,000 + 33,000 = $115,000
So our total estimated outlay for this scenario is $1,275,000
Holy crap! “Are you sure”, you ask me? Again I remind you the numbers here are inconsequential and the important thing is the methodology and the financial analysis. But in saying that, this is actually less than my most recent real-world collaborative project!
Quantifying the benefits
So we have our costs, now let’s quantify the benefits to our 1000 staff to create our cash flows.
If you go back to the section of this post entitled “The Business Drivers” there were several key cost savings.
- The company wants to improve internal efficiency by reducing wasted time on typical file server issues
- The company wants to leverage the staff available in its remote offices
We can also infer administrative savings via reduced backup/restores and improved helpdesk efficiencies. But for simplicity, let’s just look at the internal efficiency across our end users.
Since we have an assumption of staff costs ($75,000), we can do a simple savings model, based around an average productivity gain of 5 minutes per staff member per day. However, when implementing such a project like this, it is very likely that such a benefit will be realised over time, rather than straight away. So we are going to calculate this 5 minutes per day saving, by assuming that only 5% of staff have an immediate improvement, and each month, another 5% of staff gain the 5 minutes of efficiency. Therefore by year 2, we assume that our staff are now all 5 minutes more efficient.
Doesn’t sound like much, but let’s see how it looks! So, let’s do the math.
- 1000 staff, $75,000 per year. 220 working days a year and we will assume an 8 hour day.
- 75,000 / 220 / 8 = $43 per hour per staff member.
Now, let’s convert this to a 5 minute cost.
- 43 / 60 * 5 = $3.60.
Thus, as far as our assumption is concerned, 5 minutes of a staff members time per day is $3.60.
So, the daily saving for the entire payroll is:
- 3.60 * 1000 = $3600
Based on 220 working days per year the annual saving is $792,000
- 3600 * 220 = $792,000
Finally, as described above we are assuming a 5% take up rate per month, so below is the table showing this.
Now, the first year (I made 19 man days per month for ease of calculation except month 12 for a total of 220):
| Month | Staff Numbers | Calculation | Total |
| 1 (19 days) | 50 | 50 * 19 * 3.6 | $3,420 |
| 2 (19 days) | 100 | 100 * 19 * 3.6 | $6,840 |
| 3 (19 days) | 150 | 150 * 19 * 3.6 | $10,260 |
| 4 (19 days) | 200 | 200 * 19 * 3.6 | $13,680 |
| 5 (19 days) | 250 | 250 * 19 * 3.6 | $17,100 |
| 6 (19 days) | 300 | 300 * 19 * 3.6 | $20,520 |
| 7 (19 days) | 350 | 350 * 19 * 3.6 | $23,940 |
| 8 (19 days) | 400 | 400 * 19 * 3.6 | $27,360 |
| 9 (19 days) | 450 | 450 * 19 * 3.6 | $30,780 |
| 10 (19 days) | 500 | 500 * 19 * 3.6 | $34,200 |
| 11 (19 days) | 550 | 550 * 19 * 3.6 | $37,620 |
| 12 (11 days) | 600 | 600 * 11 * 3.6 | $23,760 |
| TOTAL | $249,480 |
The second year figures are as follows:
| Month | Staff Numbers | Calculation | Total |
| 1 (19 days) | 650 | 650 * 20 * 3.6 | $44,460 |
| 2 (19 days) | 700 | 700 * 20 * 3.6 | $47,880 |
| 3 (19 days) | 750 | 750 * 20 * 3.6 | $51,300 |
| 4 (19 days) | 800 | 800 * 20 * 3.6 | $54,720 |
| 5 (19 days) | 850 | 850 * 20 * 3.6 | $58,140 |
| 6 (19 days) | 900 | 900 * 20 * 3.6 | $61,560 |
| 7 (19 days) | 950 | 950 * 20 * 3.6 | $64,980 |
| 8 (19 days) | 1000 | 1000 * 20 * 3.6 | $68,400 |
| 9 (19 days) | 1000 | 1000 * 20 * 3.6 | $68,400 |
| 10 (19 days) | 1000 | 1000 * 20 * 3.6 | $68,400 |
| 11 (19 days) | 1000 | 1000 * 20 * 3.6 | $68,400 |
| 12 (11 days) | 1000 | 1000 * 10 * 3.6 | $39,600 |
| TOTAL | $696,240 |
Year 3 doesn’t need a big table. It is simply 220 * 3.6 * 1000 for a total of:
- $792,000
Now, I haven’t attempted to quantify the business driver of using staff across remote offices yet. But let’s do the cash flow analysis based on the costs and the 5 minute saving benefits just calculated.
The Discounted Cash Flow (finally!)
So, we take all of the above and produce a cash flow from it.
| Year | Cash Out | Cash In | Cash Flow |
| 0 | ($650,000) | $0 | ($650,000) |
| 1 | ($255,000) | $249,480 | ($5,520) |
| 2 | ($255,000) | $696,240 | $441,240 |
| 3 | ($115,000) | $792,000 | $677,000 |
| Total | ($1,275,000) | $1,737,720 | $462,720 |
The discount rate that I will use is 16%, so let’s see how it goes!
In Excel, I plug in the following formula:
- -650000+NPV(0.16,-5520, 441240, 677000)
and (drumroll…), the result is…
- = $106,880
So, to put it simply, based on our up-front costs of $650,000 and then applying a 16% discount rate ,we have a NPV of $106,880. This represents a 16% return on our initial $650,000 after 3 years. This, so far, looks to be a good investment.
The Internal Rate of Return
Remember my explanation of this? Internal Rate of Return allows us to estimate the discount rate that would make the project a break-even proposition. This will help us to see how much leeway we have.
Once again, Excel is your friend here…
So, if I put the year 0 to 3 cash flows into cell A1 to D1 as…
The IRR formula looks like:
- =IRR(A1:D1)
and the result is…
- 23%
This is also a good result. It means that based on our current cash flow, the discount rate would have to be higher than 23% before you would consider it not worth the risk.
Playing with the numbers
Now, let’s play with our assumptions and review the numbers.
Let’s see what happens if the project goes over budget by 20%. Here are the adjusted cash flows where I have increased cash out by 20%.
| Year | Cash Out | Cash In | Cash Flow |
| 0 | ($780,000) | $0 | ($780,000) |
| 1 | ($306,000) | $249,480 | ($56,520) |
| 2 | ($306,000) | $696,240 | $390,240 |
| 3 | ($138,000) | $792,000 | $654,000 |
| Total | ($1,530,000) | $1,737,720 | $207,720 |
Discount rate: 16%
- -780000+NPV(0.16,-56520, 390240, 654000)
- = –$119,722 (yeeouch!)
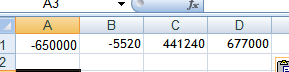
So, a 20% blowout completely kills the project as we have a negative NPV. What, then, is the break-even discount rate?
![]()
- =IRR(A1:D1)
and the result is…
- 9%
The project has a negative net present value if the discount rate is any more than 9%. Not good is it!?
Modeling Fun
So, if the caffeine is holding up and you are still with me, I hope that you start to see how we now have a model where we can modify the scenario in different ways and then repeat the calculations.
For example, we have neither quantify the benefits of farming out work to remote offices, nor come up with a way to work out a dollar figure for reducing helpdesk calls, improving response times, etc.
I am not going to do that here because you would need more caffeine in your system to keep your neurons going. But as a final example of fiddling with the model, let’s go back to the original cash flows except this time we base it on staff saving 4 minutes per day, instead of 5.
You can do the math yourself if you want to verify, however can tell you that the Year 1 to Year 3 cost savings for 1000 staff at a 5% uptake rate would be:
- Year 1: $199,584
- Year 2: $556,992
- Year 3: $633,600
| Year | Cash Out | Cash In | Cash Flow |
| 0 | ($650,000) | $0 | ($650,000) |
| 1 | ($255,000) | $199,584 | ($54,416) |
| 2 | ($255,000) | $556,992 | $301,992 |
| 3 | ($115,000) | $663,600 | $548,600 |
| Total | ($1,275,000) | $1,420,176 | $145176 |
Discount rate: 16%
- -650000+NPV(0.16,-54416, 301992, 548600)
- = –$121,016 (double yeeouch!)
As you can see, that one (1) minute can make a big difference!! 🙂 Better cut out all toilet breaks as part of the SharePoint implementation to get it over the line!
Conclusion
This was a long post, and if you think it was hard to read, I can assure you it was a total bitch to write. But if you take anything away from this 3rd post in the series, I hope that you come away with an appreciation of the “non technical”, “non designer” and “non development” point of view.
All that has been presented here is just scratching the surface of this sort of financial modelling, but for my audience here, the material and concepts here are basically more than enough for your needs. When I have completed the other two scenarios, I’ll revisit some of the theory and cover some more advanced techniques if I’m not completely sick of it 🙂
*blatant plug alert* – if you would like to undertake a more comprehensive feasibility study for your company along these lines, with detailed technical and governance considerations, logical architecture with financial modeling, contact me 🙂
So, I hope that you took something positive away from this post and I look forward hearing if it made sense to you 🙂
over and out..
Paul


November 30th, 2007 at 12:21 am |
I loved these articles. Any chance you could do a series on project management/feasability in an XP style proces with option pricing.
November 30th, 2007 at 7:27 am |
Thats for the kind words.. funny you should mention it, but every time in the articles I mention that this is just the basic techniques, I was always thinking of option pricing. It may be the last post or another series later. The maths and theory is more complex, so it may be hard to make it an easy to read post. Writing these financial oriented articles is hard!
December 8th, 2007 at 7:30 pm |
Hiya Paul.
I just registered to tell you that I very much appreciate these articles. I’m dabbling with this myself as I move on from the guy implementing the solutions to the guy designing them so any help is very much appreciated.
Keep up the great work!
December 8th, 2007 at 11:02 pm |
Thanks Martin, I really appreciate it. Its hard to know how much interest there is in this side of things. Its not specifically a SharePoint thing we are covering here, but SharePoint has so many things you need to cover off it is a good case study..
January 5th, 2008 at 10:15 am |
This is excellent work, thank you very much. As a business sponsor, I am going to use this to push my IT staff to improve their plan.
January 5th, 2008 at 6:35 pm |
Thanks for the feedback – as a project sponsor, I’d suggest you also read my post on collaborative document management as well as the kung fu article about company readiness. They are all very relevent to the financial side of things as well.
Some of the motivation for me to write those two articles came from a project early last year where two key stakeholder did not have a good enough appreciation of what they were getting themselves into.
regards
Paul
January 7th, 2008 at 12:45 pm |
[…] in my ‘talk to your CFO’ series of posts that in the collaborative document management scenario, gaining only 4 minutes of improved efficiency per day for staff as opposed to 5 minutes can make […]
January 25th, 2008 at 12:23 pm |
Enterprise Collaboration and Virtual Teams Report (January 24, 2008)…
The People Part of Enterprise Collaboration and Virtual Teams Paul outlines a process for talking to your CFO about the use of SharePoint for collaboration scenarios; the main idea is how to talk to him or her in their language….
March 24th, 2008 at 9:42 pm |
[…] in the next post of this series, we will look at a “Collaborative Intranet/Extranet” scenario, and see […]
April 27th, 2008 at 11:28 pm |
[…] complex and overlooked area in document oriented collaboration projects. I specifically modelled a mythical project budget estimate in my return on investment series on this exact project type. Being document centric, it is the […]
May 8th, 2008 at 10:28 pm |
So, given productivity is so hard to measure, in real world implementations have you been able to come up with some actual numbers? You mention 5 minutes in this example, and showed how much a single minute (down to 4) can change the ROI significantly…
May 9th, 2008 at 12:13 am |
yes mate you are absolutely right and the 5 minute thing is actually a pretty terrible measure to use (but was good for this example).
I suggest your answer is to do some research into process improvement theory like Lean/Six Sigma. Don’t take it for granted whats there, but they are extremely focussed on “eliminate gut feel, trust the data” and I have found this has the info I needed to turn problems into something quantifiable. Once you do that, then ROI is a snap.. (okay well its easier)
June 3rd, 2008 at 10:06 pm |
[…] and training I could also give you an answer with a fair degree of confidence as I’ve done many times. But then by definition, we are not talking about a wicked problem are […]
February 11th, 2009 at 11:41 pm |
[…] Learn to talk to your CFO : Collaboration scenario – Part 3 […]
August 20th, 2009 at 1:08 am |
[…] http://www.cleverworkarounds.com/2007/11/28/learn-to-talk-to-your-cfo-collaboration-scenario-part-3/ (*blush*, I had never read your book when doing this […]
April 14th, 2010 at 3:49 am |
great advice
September 23rd, 2010 at 2:47 pm |
Excellent articles overall – repeatedly struggling with Sharepoint business cases and ROI. But as you point out in some other articles the underlying problem is often a lack of clarity and shared understanding about what the actual goals of the project are.
May 29th, 2011 at 3:04 am |
[…] CleverWorkarounds » Learn to talk to your CFO : Collaboration … – Hi. This is the third article in a series that attempts to explain some financial analysis techniques to non financial oriented IT people. My first two articles in this series were theory and background and this is the … […]