Demystifying SharePoint Performance Management Part 10 – More tools of the trade…
Hi all and welcome to the tenth article in my series on demystifying SharePoint performance management. I do feel that we are getting toward the home stretch here. If you go way back to Part 1, I stated my intent to highlight some common misconceptions and traps for younger players in the area of SharePoint performance management, while demonstrating a better way to think about measuring SharePoint performance (i.e. lead and lag indicators). While doing so, we examined the common performance indicators of RPS, IOPS, MBPS, latency and the tools and approaches to measuring and using them.
I started the series praising some of Microsoft’s material, namely the “Planning guide for server farms and environments for Microsoft SharePoint Server 2010.”, “Capacity Planning for Microsoft SharePoint Server 2010” and “Analysing Microsoft SharePoint Products and Technologies Usage” guides. But they are not perfect by any stretch, and in last post, I covered some of the inconsistencies and questionable information that does exist in the capacity planning guide in particular. Not only are some of the disk performance figures quoted given without any critical context needed to understand how to measure them in a meaningful way, some of the figures themselves are highly questionable.
I therefore concluded Part 9 by advising readers not to believe everything presented and always verify espoused reality with actual reality via testing and measurement.
Along the journey that we have undertaken, we have examined some of the tools that are available to perform such testing and measurement. So far, we have used Log Parser, SharePoint Flavored Weblog Reader, Windows Performance Monitor, SQLIO and the odd bit of PowerShell thrown in for good measure. This article will round things out by showing you two additional tools to verify theoretical fiction with hard cold reality. Both of these tools allow you to get a really good sense of IO patterns in particular (although they both have many other purposes). The first of which will be familiar to my more nerdy readers, but the second of which is highly powerful, but much lesser known to newbies and seasoned IT pros alike.
So without further adieu, lets meet our tools… Process Monitor and Windows Performance Analysis Toolkit.
Process Monitor
Our first tool is Process Monitor, also commonly known as Procmon. Now this tool is quite well known, so I will not be particularly verbose with my examination of it. But for the three of you who have never heard of this tool, Process Monitor allows us to (among many other things), monitor accesses to the file system by processes running on a server. This allows us to get a really low level view of IO requests as they happen in real time. What is really nice about Process Monitor is its granularity. It allows you to set up some sophisticated filtering that allows you to really see the wood from the trees. For example, one can create fairly elaborate filters that allow you to just see the details of a specific SQL database. Also handy is that all collected data can be saved to file for later examination too.
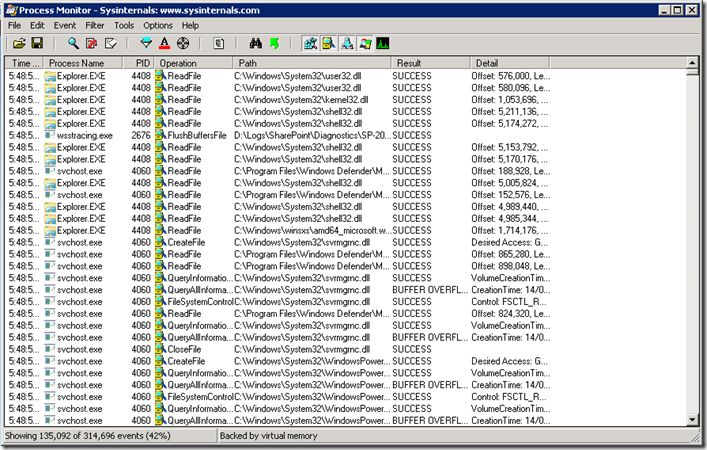
When you start Process Monitor, you will see a screen something like the one below. It will immediately start collecting data about various operations (there are around 140 monitorable operations that cover file system, registry, process, network and kernel stuff). When you launch Process Monitor it immediately starts monitoring file system, registry and processes. The default columns that are displayed include:
- the name of the process performing the operation
- the operation itself
- the path to the object the operation was performed on
- (and most importantly), a detail column, that tells you the good stuff.
The best way to learn Process Monitor is by example, so lets use it to collect SQL Server IO patterns on SharePoint databases when performing a full crawl in SharePoint (while excluding writes to transaction logs). It will be interesting to see the the range of IO request sizes during this time. To achieve this, we need to set up the filters for procmon to give us just what we need…
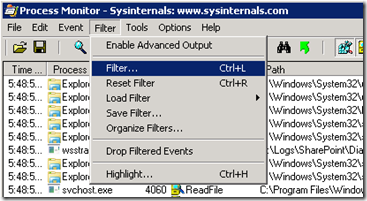
First up, choose “Filter…” from the Filter menu.
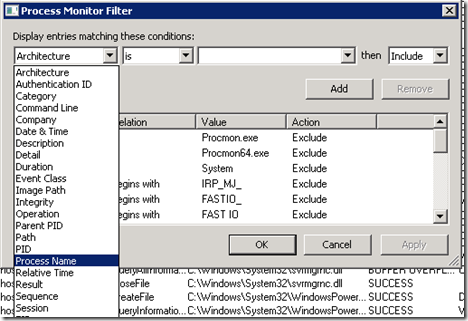
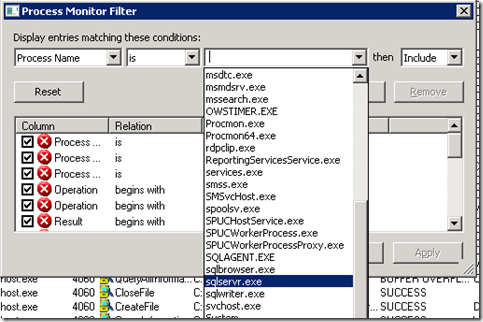
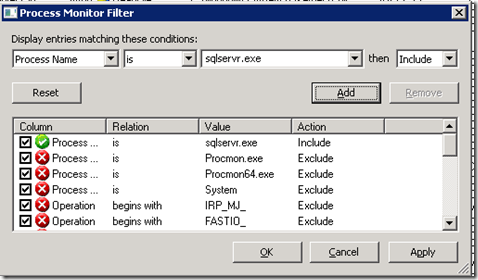
In the top left column, choose “Process Name” from the list of columns. Leave the condition field as “is” and click on the drop down next to it. It will enumerate the running processes, allowing you to scroll down and find sqlservr.exe.
Click OK and your newly minted filter will be added to the list (check out the green include filter below). Now we will only see operations performed by SQL Server in the Process Monitor display.
Rather than give you a dose of screenshot hell, I will not individually show you how to add each filter as they are a similar process to what we just did to include only SQLSERVR.EXE. In all, we have to apply another 5 filters. The first two filter the operations down to reading and writing to the disk.
- Filter on: Process Name
- Condition: Is
- Filter applied: ReadFile
- Filter type: Include
- Filter on: Process Name
- Condition: Is
- Filter applied: WriteFile
- Filter type: Include
Now we need to specify the database(s) that we are interested in. On my test server, SharePoint databases are on a disk array mounted as D:\ drive. So I add the following filter:
- Filter on: Path
- Condition: Contains
- Filter applied: D:\DATA\MSSQL
- Filter type: Include
Finally, we want to exclude writes to translation logs. Since all transaction logs write to files with an .LDF extension, we can use an exclusion rule:
- Filter on: Path
- Condition: Contains
- Filter applied: LDF
- Filter type: Exclude
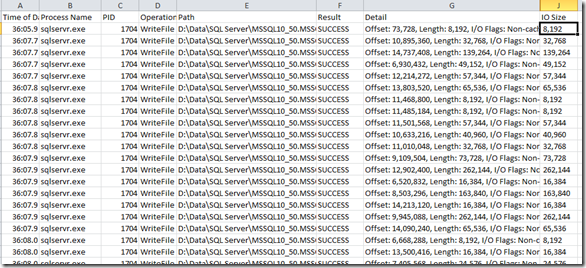
Okay, so we have our filters set. Now widen the detail column that I mentioned earlier. If you have captured some entries, you should see the word “Length :” with a number next to it. This is reporting the size of the IO request in bytes. Divide by 1024 if you want to get to kilobytes (KB). Below you can see a range of 1.5KB to 32KB.
At this point you are all set. Go to SharePoint central administration and find the search service application. Start a full crawl and fairly quickly, you should see matching disk IO operations displayed in Process Monitor. When the crawl is finished, you can choose to stop capturing and save the resulting capture to file. Process Monitor supports CSV format, which makes it easy to import into Excel as shown below. (In the example below I created a formula for the column called “IO Size”.
By the way, in my quick test analysis of disk IO of a window during during part of the during a full crawl, I captured 329 requests that were broken down as follows:
- 142 IO requests (42% of total) were 8KB in size for a total of 1136KB
- 48 IO requests (15% in total) were 16KB in size for a total of 768KB
- 48 IO requests (15% in total) were >16KB to 32KB in size for a total of 1136KB
- 49 IO requests (15% in total) were >32KB to 64KB in size for a total of 2552KB
- 22 IO requests (7% in total) were >64KB to 128KB in size for a total of 2104KB
- 20 IO requests (6% in total) were >128KB to 256KB in size for a total of 3904KB
Windows Performance Analyser (with a little help from Xperf123)
Allow me to introduce you to one of the best tools you never knew you needed. Windows Performance Analyser (WPA) is a newer addition to the armoury of tools for performance analysis and capacity planning. In short, it takes the idea of Windows Performance Monitor to a whole new level. WPA comes as part of a broader suite of tools collectively known as the Windows Performance Toolkit (WPT). Microsoft describes the toolkit as:
…designed for analysis of a wide range of performance problems including application start times, boot issues, deferred procedure calls and interrupt activity (DPCs and ISRs), system responsiveness issues, application resource usage, and interrupt storms.”
If most of those terms sounded scary to you, then it should be clear that WPA is a pretty serious tool and has utility for many things, going way beyond our narrow focus of Disk performance. But never fear BA’s, I am not going to take a deep dive approach to explaining this tool. Instead I am going to outline the quickest and simplest way to leverage WPA for examining disk IO patterns. In fact, you should be able to follow what I outline here on your own PC if SharePoint is not conveniently located nearby.
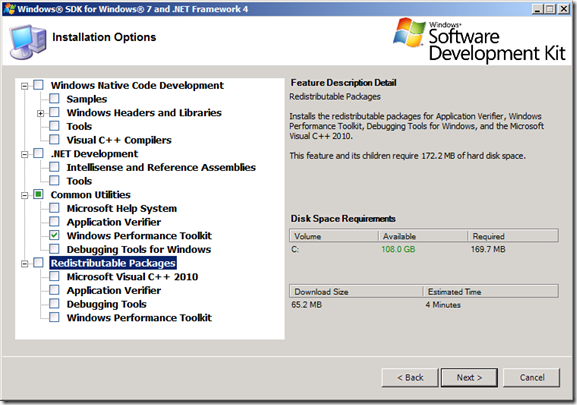
Now this gem of a tool is not available as a separate download. It actually comes installed as part of the Microsoft Windows SDK for Windows 7 and .NET Framework 4. Admins fearing bloat on their servers can rest easy though, as you can choose just to install the WPT components as shown below…
By default, the windows performance toolkit will install its goodies into the C:\Program Files\Microsoft Windows Performance Toolkit” folder. So go ahead and install it now since it can be installed onto any version of Windows past Vista. (I am sure that none of you at all are reading this article on an Apple device right? :-).
Now assuming you have successfully installed WPT, I now want you to head on over to codeplex and download a little tool called Xperf123 and save it into the toolkit folder above. Xperf123 is a 3rd party tool that hides a lot of the complexity of WPA and thus is a useful starting point. The only thing to bear in mind is that Xperf123 is not part of WPA and is therefore not a necessity. If your inner tech geek wants to get to know the WPA commands better, then I highly recommend you read a highly comprehensive article written by Microsoft’s Robert Smith and published back in Feb 2012. The article is called “Analysing Storage Performance using the Windows Performance Analysis Toolkit” and it is an outstanding piece of work in this area.
So we are all set. Let’s run the same test as we did with Procmon earlier. I will start a trace on my test SharePoint server, run a full crawl and then look at the resulting IO patterns. Perform the following steps in sequence. (in my example I am using a test SharePoint server).
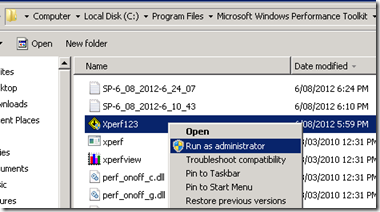
- Start Xperf123 from the WPT installation folder (run it as administrator).
- At the initial screen, click Next and then Next again at the screen displaying operating system details
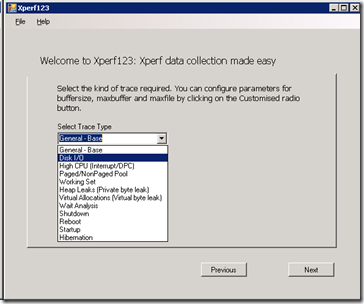
- From the Select Trace Type dropdown, choose Disk I/O and press Next
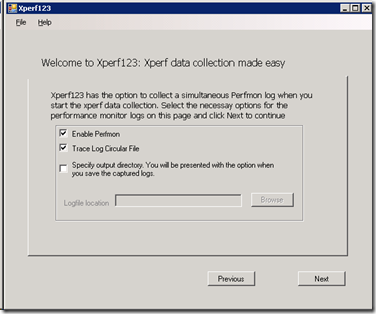
- Ensure that “Enable Perfmon”, “use Circular Logging” and optionally choose “Specify Output Directory”. Press Next
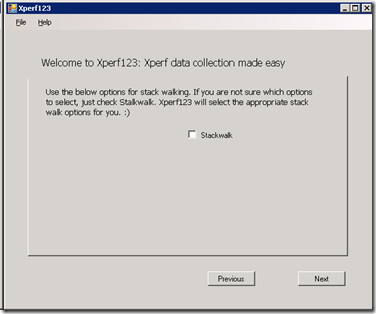
- Leave “Stackwalk” unticked and choose Next
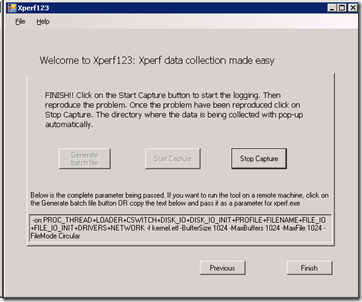
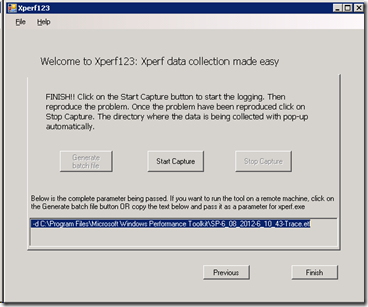
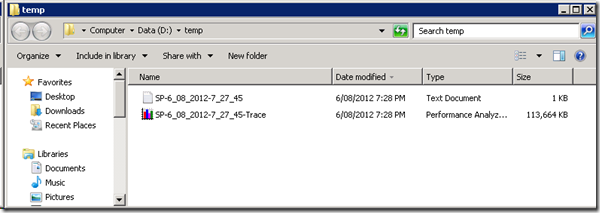
AllrIghtie then… we are all set! Click the Start Capture Button to start collecting the good stuff! Xperf123 will run the actual WPA command line trace utility (called xperf.exe if you really want to know). Now go to SharePoint central administration and like what we did with our test of Process Monitor, start a full crawl. Wait till the crawl finishes and then in Xperf123, click the Stop Capture Button. A trace file will be saved in the WPT installation folder (or wherever you specify). The naming convention will be based on the server name and date the trace was run.
Okay, so capturing the trace was positively easy. How about analysing it visually?
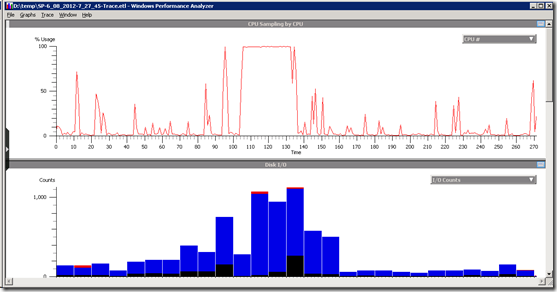
Double click on the newly minted trace file and it will be loaded into the Performance Analyser analysis tool (This tool is also available from the Start menu as well). When the tool loads and processes the trace file, you will see CPU and Disk IO counts reported visually. The CPU is the line graph and IO counts are represented in a bar graph. Unlike Windows Performance Monitor which we covered in Part 7, this tool has a much better ability to drill down into details.
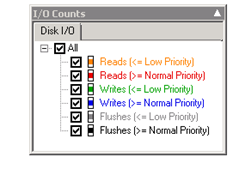
If you look closely below there are two “flyout” arrows. One is on the left side in the middle of the screen and applies to all graphs and the other is on the top-right of each graph. If you click them, you are able to apply filters to what information is displayed. For example: if you click the “IO Counts” flyout, you can filter out which type of IO you want to see. Looking at the screenshot below, you can see that the majority of what was captured were disk writes (the blue bars below).
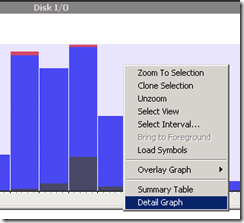
Okay so lets get a closer look at what is going on disk-wise. Right click somewhere on the Disk IO bar graph and choose “Detail Graph” from the menu.
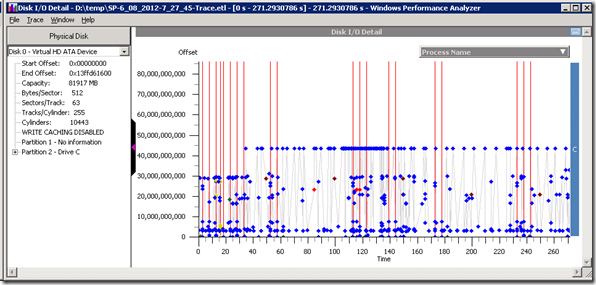
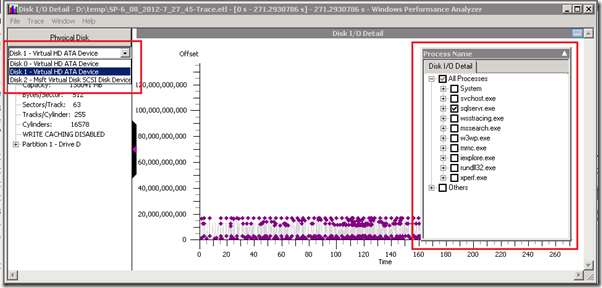
Now we have a very different view. On the left we can see which disk we are looking at and on the right we can see detailed performance stats for that disk. It may not be clear by the screenshot, but the disk IO reported below is broken down by process. This detailed view also has flyouts and dropdowns that allow you to filter what you see. There is an upper-left dropdown menu under the section called “Physical Disk”. This allows you to change what disk you are interested in. On the upper right, there is a flyout labelled “Process Name”. Clicking this allows you to filter the display to only view a subset of the process that were running at the time the trace was captured.
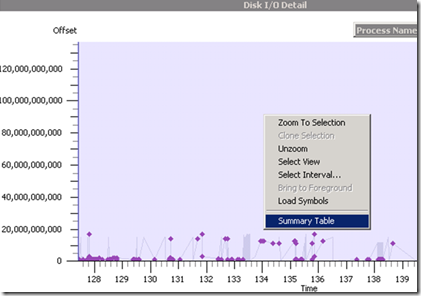
Now in my case, I only want to see the SQL Database activity, so I will make use of the aforementioned filtering capability. Below I show where I selected the disk where the database files reside and on the right I deselected all processes apart from SQLSERVR.EXE. Neat huh? Now we are looking at the graph of every individual IO operation performed during the time displayed and you can even hover over each dot to get more detail of the IO operation performed.
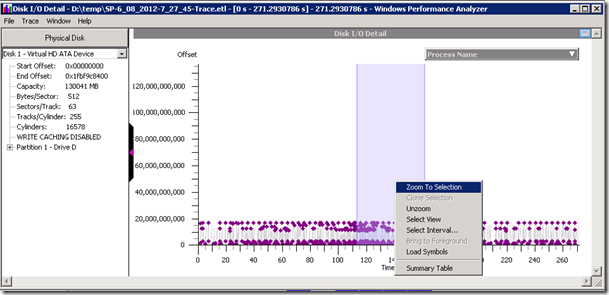
You can also zoom in with great granularity. Simply select a time period from the display using by dragging the mouse pointer over the graph area. Right click the now selected time period and choose “Zoom to Selection”. Cool eh? If your mouse has a wheel button, you can zoom in and out by pressing the Ctrl key and rolling the mouse wheel.
Now even for most wussy non technical BA reading this, surely your inner nerd is liking what you see. But why stop here? After all, Process Monitor gave us lots more loving detail and had the ability to utilise sophisticated filtering. So how does WPA stack up?
To answer this question, try these steps, Right click on the detail graph and this time choose “Summary Table”. This allows us to view even more detail of IO data.
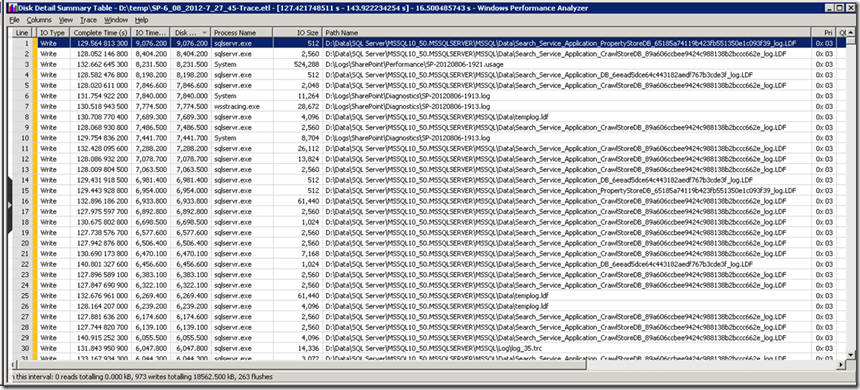
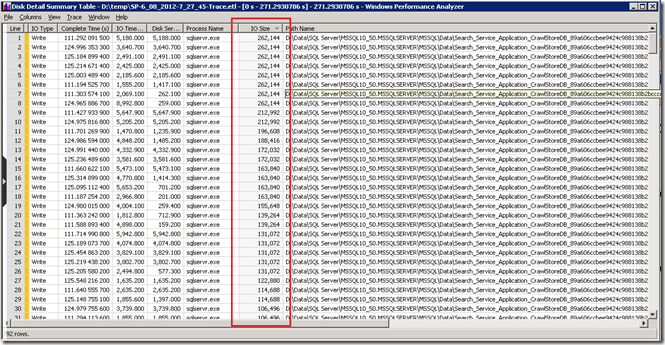
Viola! We now have a list of every IO transaction performed during the sample period. Each line in the summary table represents a single I/O operation. The columns are movable and sortable as well. On that note, some of the more interesting ones for our purposes include (thanks Robert Smith for the explanation of these):
- IO Type: Read, Write, or Flush
- Complete Time: Time of I/O completion in milliseconds, relative to start and stop of the current trace.
- IO Time: The amount of time in milliseconds the I/O took to complete
- Disk Service Time: The inferred amount of time (in microseconds) the IO operation has spent on the device (this one has caveats, check Robert Smiths post for detail).
- QD/I: Queue Depth the disk , irrespective of partitions, at the time this I/O request initialized
- IO Size: Size of this I/O, in bytes.
- Process Name: The name of the process that initiated this I/O.
- Path: Path and file name, if known, that is the target of this I/O (in plain English, this essentially means the file name).
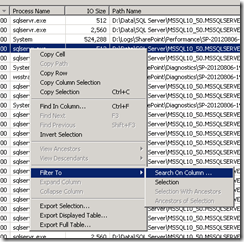
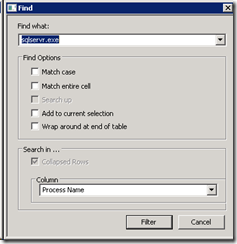
I have a lot of IO requests in this summary view, so let’s see how this baby can filter. First up, lets only look at IO that was initiated from SQL Server only. Right click on the “Process Name” column and choose “Filter To” –> “Search on Column…” In the resulting window, enter “SQLSERVR.EXE” in the “Find what:” textbox. Double check that the column name is set to “Process name” in the dropdown and click Filter.
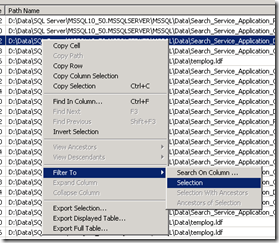
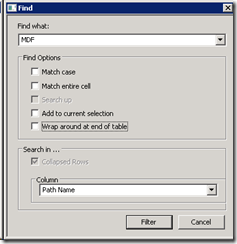
You should now see only SQL IO traffic. So let’s drill down further still. This time I want to exclude IO transactions that are transaction log related. To do this, right click on the “Path Name” column and choose “Filter To” –> “Search on Column…” In the resulting window, enter “MDF” in the “Find what:” textbox. Double check that the column name is set to “Path name” in the dropdown and click Filter.
Can you guess the effect? Only SQL Server database files will be displayed since they typically have a file extension of MDF.
In the screenshot below, I have then used the column sorting capability to look at the IO sizes. Neat huh?
Don’t forget Performance Monitor…
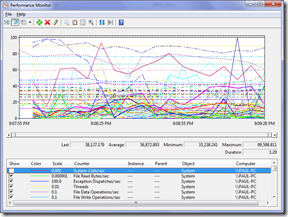
Just before we are done with Windows Performance Analysis Toolkit, cast your mind back to the start of this walkthrough when we used Xperf123 to generate this trace. If you check back, you might recall there was a tickbox in the Xperf123 wizard called “Enable Perfmon”. Well it turns out that Xperf123 had one final perk. While the WPA trace was made, a Perfmon trace was made of the system performance more broadly during the time. These logs are located in the C:\PerfLogs\ directory and are saved in the native Windows Performance Monitor format. So just double click the file and watch the love…
How’s that for a handy added bonus. It is also worth mentioning that the Perfmon trace captured has a significant number of performance counters in the categories of Memory, PhysicalDisk, Processor and System.
Conclusion and coming next…
Well! That was a long post, but that was more because of verbose screenshots than anything else.
Both Windows Performance Monitor and Windows Performance Analyser are very useful tools for developing a better understanding of disk IO patterns. While Procmon has more sophisticated filtering capabilities, WPA trumps Procmon in terms of reduced overhead (apparently 20,000 events per second is less than 2% CPU on a 2.0 GHz processor ). WPA also has the ability to visualise and drill down into the data better than Procmon can do.
Nevertheless, both tools have far more utility beyond the basic scenarios outlined in this series and are definitely worth investigating more.
In the next and I suspect final post, I will round off this examination of performance by making a few more general SharePoint performance recommendations and outlining a lightweight methodology that you can use for your own assessments.
Until then, thanks for reading…
Paul Culmsee




August 11th, 2012 at 12:38 am |
Ping back from http://kerseub.wordpress.com/2012/08/10/asaow-demystifying-sharepoint-performance-management/
August 16th, 2012 at 8:23 pm |
[…] SharePoint Performance Management Part 9 – Don’t believe everything you R/WDemystifying SharePoint Performance Management Part 10 – More tools of the trade…Demystifying SharePoint Performance Management Part 11 – Tales from the Microsoft labs Hi all […]