Back to Cleverworkarounds mainpage
 

The one best practice to rule them all – Part 2

image

Hi all

This is part of a somewhat self-indulgent story of how I came to practice a craft that has made a profound difference on how I approach and manage SharePoint projects. If you have not read part 1, then I suggest you stop now and read that first. This post will really not make a lot of sense, otherwise :-).

In my last exciting instalment, I had concluded with the time where I discovered the term “Wicked problems” and the work of Horst Rittel, who coined the term. In his landmark 1973 paper, Rittel identified ten common characteristics of wicked problems. I remember quite distinctly, reading through that list for the first time, having this strange sense of relief. Of the characteristics, most of them had *clearly* manifested in my SharePoint-gone-haywire project. The relief stemmed from the fact that it was a recognised phenomena with a tendency to defy traditional problem solving techniques. The characteristics with which I immediately identified are marked in bold below.

  1. There is no definitive formulation of a wicked problem.
  2. Wicked problems have no stopping rule.
  3. Solutions to wicked problems are not true-or-false, but better or worse.
  4. There is no immediate and no ultimate test of a solution to a wicked problem.
  5. Every solution to a wicked problem is a “one-shot operation”; because there is no opportunity to learn by trial-and-error, every attempt counts significantly.
  6. Wicked problems do not have an enumerable (or an exhaustively describable) set of potential solutions, nor is there a well-described set of permissible operations that may be incorporated into the plan.
  7. Every wicked problem is essentially unique.
  8. Every wicked problem can be considered to be a symptom of another problem.
  9. The existence of a discrepancy representing a wicked problem can be explained in numerous ways. The choice of explanation determines the nature of the problem’s resolution.
  10. The planner has no right to be wrong (planners are liable for the consequences of the actions they generate).

But the real clincher – the moment that made me realise that my frustrating journey through standards, methodologies and best practices was finally coming to an end was the 5th characteristic. “Every solution to a wicked problem is a “one -shot operation”. When I read that one, it was as if my famous “Skype-vs-SharePoint” guy suddenly materialised in front of me and mooned me saying over and over again “I can collaborate on Skype, too!”

For those of you who skipped part 1 despite warnings, “We only have one shot at this” was pretty much a word-for-word quote on what was said to me in the haywire project that started all of this.

Is it any surprise that I felt I was onto something here?

Digging deeper

When I read Rittel’s 1973 paper, I began to get a deeper understanding of what he meant by his first two characteristics that I didn’t immediately identify with. Namely “there is no definitive formulation of a wicked problem” and “wicked problems have no stopping rule”.

I soon realised that these two characteristics were actually the most *prevalent* characteristics of complex IT projects and therefore, the list was even *more* relevant to me than I had originally thought. After that, I was a convert. Rittel explained the first characteristic as follows…

The information needed to understand the problem depends upon one’s idea for solving it. That is to say: In order to describe a wicked-problem in sufficient detail, one has to develop an exhaustive inventory of all conceivable solutions ahead of time. The reason is that every question asking for additional information depends upon the understanding of the problem–and its resolution–at that time. Problem understanding and problem resolution are concomitant to each other.

The second characteristic, “no stopping rule”, is a natural consequence of the above issue. Again, quoting Rittel from 1973…

Because (according to Proposition 1) the process of solving the problem is identical with the process of understanding its nature, because there are no criteria for sufficient understanding […] , the would-be planner can always try to do better. Some additional investment of effort might increase the chances of finding a better solution.

Skype-vs-SharePoint guy, who now has the credit of being one of the most significant unwitting teachers of my career, went from not knowing any difference between SharePoint and Skype, to suggesting work items that already existed in the project plan, to telling us how we should build our information architecture based on 1990’s era document management systems. It was crystal clear that he went through this iterative process of changing his understanding of the problem based on how much thought he had put into the solution.

The sad fact was that Skype-vs-SharePoint guy was not unique. He might have been an extreme case, but in reality, he was simply the latest in a long line of users and stakeholders who I would have previously dismissed as idiots, computer illiterate or just plain tossers. Is it any wonder why we have the scourge of “scope creep” and “vague and incomplete requirements” that are so commonly cited as project failure factors? How many times have you banged your head against the wall thinking “How can we build a system when they don’t know what they want!”?

Problem fundamentalism

So in a way, we, as solution architects, developers and consultants, are just as much at fault as those users who we chastise because they “don’t know what they want”. Why? We fail to recognise or account for the immutable fact that understanding of a problem is not cut-and-dry. It almost certainly will change over time as people mull over, work through, learn from and grapple with the nature of a problem and the complexities of the interlocking issues that form the problem. To make matters worse, we all do this *individually* and at *different speeds* with *different value sets*. Inevitably, we arrive at different conclusions based on different paths we take on making sense of it all.

That cyclical nature of understanding the problem, based on understanding the solution, does not automatically stop once the scope document has been signed off, either. It will continue over and over again as a perfectly natural part of the learning process. With that in mind, consider all of the studies that have looked into factors causing project failure (uncle google shows up many studies). All of the usual suspects are there. For example…

  • Scope creep
  • Incomplete requirements
  • Unclear objectives
  • Lack of user involvement
  • Unrealistic or overly optimistic time frames
  • Lack of resources

blah…blah…blah – I am sure that you have seen these before.

If you accept Rittel’s assertion that the problem and the solution are intertwined and concomitant, then it is clear that the sorts of factors listed above are merely *symptoms*, not causes. *Of course* there are incomplete requirements and scope creep. There would have to be incomplete requirements and scope creep almost by *definition* for a complex project. For a long time I had instinctively felt this way, but I couldn’t quite put my finger on it… until SharePoint-vs-Skype guy, Horst Rittel and Jeff Conklin showed me the way.

At the end of the day, it all boils down to this:

Projects fail principally because there is a lack of *shared understanding* among the participants of that project. Additionally, shared understanding is a prerequisite before the key thing that makes or breaks a project – shared commitment.

image

(Stunned silence … Paul hears pin drop)

I can imagine some reader comments at this point:

  • “Big $%#$ deal, tell me something I don’t know”.
  • “What the….you made me read through one and a half blog posts for *that*?”
  • “So what theory-boy, tell me *how* to actually develop shared understanding”
  • “Paul can you tell me the difference between SharePoint and Twitter?” 🙂

To be fair, I think most people know instinctively that a lack of shared understanding is the major cause of projects being comatose before they barely got off the ground. But if it was so obvious why does scope continue to creep? Why are objectives still unclear? And, why are requirements and specifications incomplete? To answer that, we need to turn the “shared understanding” assertion around and ask it in this way.

Let’s suspend reality and just assume for a minute that all participants have an *identical* deep and tacit understanding of a really complex problem. Would we still have the incomplete requirements, unclear objectives, scope creep, unrealistic time frames that are cited as project failure factors?

I say “no” from a philosophical standpoint, but a “Well, yes… but much less than what normally happens” from a pragmatic standpoint.

Thus, I started to look at my SharePoint engagements through different eyes and became what I now think should be called a “problem fundamentalist”. I began to believe that if you could achieve the utopian dream of complete shared understanding among participants at the very start of a project, then really, you could use any methodology you like to actually manage the problem and implement the solution. The common factors of project failure would fall drastically.

So finally for now, is it simply just a matter of dealing with the little question of *how* to actually achieve this goal of shared understanding?

We will talk about that in part 3…


Thanks for Reading

Paul Culmsee


"Wicked Problem" Best Practice Slides and Demo Materials posted

Hi all. I’ve just posted my Best Practices Conference slide deck for the Wicked Problems session, along with the maps that I used during the demonstration. Expect a typically long post really soon now, to delve into much more detail about all of this 🙂

For what it’s worth the conversion to slideshare was a bit wonky, so just contact me if you want a pptx version.

Iframe below too small? Then go here for the demo issue maps

[iframe /BPCMaps/Best_Practices_Share_192168511229769555699.html 800 600]


More on the Best Practice SharePoint Conference – Feb 2-4 2009 in San Diego!

Hi all

I have been extremely quiet on the blogging front lately, because I have been extremely busy, splitting my time between working on my two presentations for the up-coming Best Practices SharePoint Conference, as well as wearing my undies on the outside (ala superman), deep in the bowels of some unhealthy SharePoint farms, nailing various technical and governance issues and helping organisations regain some lost assurance. On top of that, I’ve also been doing a lot of non IT related work in a group facilitation discipline.

image

I thought it’s about time I emerged from this big mushroom I find myself under to let you know more about what I will be speaking about, as well as some of the other speakers and topics that I really looking forward to. Seriously, we are in the company of giants with this conference. The caliber and quality of the speakers has me wondering what the hell I am doing there!

I mean we have all the "A list" big kids of the SharePoint world there. Gary Lapointe is a freakin’ bona fide superstar! – via his STSADM extensions, he has saved the asses of more SharePoint admins and developers than even Joel has. Robert Bogue is an even better all-rounder than Andrew Symonds (sorry non cricketing countries you won’t get that analogy) and touches on a wider variety of topics than anyone else I have ever come across. Then there the likes of Andrew Woodward, Ben Curry, Bob Mixon, Eric Shupps, fellow metalhead Mike Watson, Ruven Gotz and Todd Bleeker just to name a few!

Somehow I have to squeeze in a beer with all of them yet stay sober enough to present. That’s a tough ask!

Anyway, both of my sessions are in the CIO stream and I think are rather topical given the current financial crisis crap that is happening around the world.

My first session is called "How to avoid SharePoint becoming a wicked problem". This is a pet topic of mine – something that I have spent a lot of time on, and developing new skills in (hence the aforementioned facilitation work). For the record, I didn’t make up the term "wicked problem" – its been a subject of academic research since the term was first coined in the early 1970’s. This session is going to cover a lot of what I have learned on this topic including how to spot SharePoint wickedness early, recognise it for what it is, and apply the *right* sort of tools and techniques to mitigate it.

I do worry that people will find some of my stuff a little too left field, but I do have the results to attest to the value and power of these techniques and I am really looking forward to sharing my methods and comparing with what has worked for other presenters and attendees.

The second topic is on the topic of good old SharePoint Return on Investment (ROI). I’m one of these people that believe most things can be measured or quantified. I’ve always wanted to return to my series on "How to Speak to your CFO" and continue down that road. Given we have entered once in a lifetime era of falling profit, plummeting asset prices, reduced budgets, costlier finance and great uncertainty, my quest for bringing a lasting peace to the cold war between managers and geeks moves to San Diego 🙂

My aim for this session is to allow non SharePoint people to understand where some of the hidden costs are SharePoint, as well as show SharePoint people the basic financial tools for ROI modelling and secondly, I will explain how to build an ROI decision model and provide a scenario that we will try out some different assumptions with.

As for the rest of the veritable *buffet* of topics – where do you start? First up, I am torn between Bill’s "Aligning your Information and Findability Architectures using SharePoint Server 2007 Technologies" and Yoda Bogue’s "Selling Governance in your Organization". If I go to Bill’s session, then I’ll definitely be attending Robert’s Governing Development in SharePoint session.

In the afternoon, it gets even harder! You have "Transform the My Site into an Information Hub" by Mark Eichenberger, Bob Mixon’s "Learn why Taxonomies are the Most Important Part of any Document or Information Asset Management System, How to Facilitate the Government out of Governance by Virgin Carrol and Nuts and Bolts Governance- Practical Application of the Concepts

.. and that’s just day one!

Seriously people, no matter that sort of SharePoint sub disciplines push your buttons, you are going to get extreme value for money here. You will come away with an amazing amount of material that will result in real and tangible cost savings across various areas of the SharePoint realm.

If you live in California or anywhere in the US – there is no excuse 🙂 If *I* have to spend 25+ hours cooped up in  plane just to get there and survive the jet-lag to present, then you should come on down and join the fun.

Hope to see you there!

Paul Culmsee


Report on which web2.0 technologies work for the enterprise

I thought that this article was topical given that I am writing on how organisational culture and behavioural style impacts the sorts of collaborative tools that individuals and organisations gravitate to and find useful.

The reports cover 11 common Web 2.0 technologies that can potentially find value in the enterprise:

  • microblogs,
  • prediction markets,
  • social networking,
  • widgets,
  • blogs,
  • RSS feeds,
  • wikis,
  • forums,
  • podcasts, and
  • social bookmarks.

http://www.destinationcrm.com/Articles/CRM-News/Daily-News/Wikis-Grow,-Podcasts-and-Social-Bookmarking-Slow-51507.aspx

The short version for those who can’t be stuffed reading it?

  • Microblogs – too early to tell
  • Forums, Podcasts and Social Bookmarking are not seen as strategically valuable to enterprises.
  • Wikis are popular and well adopted, blogs also popular (but less than wikis)
  • Social networking tools are finding value in certain demographics but have not really taken off yet

Do readers agree with their conclusions?

I have to say that regarding forums, a lot of clients ask for them and many always seem to be blank 🙂


Root Causes of Communication Fragmentation: Organisational Culture

This is the second article in a series of articles which examine factors causing the sort of organisational inefficiencies that lead people to use products like SharePoint. My first article in the series examined individual learning and behavioural styles and their impact on communication and how those same learning and behavioural styles still manifest themselves in collaborative tools and informational architecture.

We now turn our attention away from individuals and look at the collection of individuals known as the "organisation". In the first article, I lamented the fact that it seemed no empirical study had even been performed to determine the relationship between behaviour/learning styles and specific collaborative tools/techniques. Fortunately for me, in writing this second article, organisational culture has long been recognised as just about *the* most critical factor in organisational success. What that essentially translates to, is that there is an absolute *plethora* of research on the topic of the influence of organisational culture in knowledge management. In writing this article I had a severe case of information overload but fortunately found exactly what I was looking for.

Knowledge management in academia

Academic papers tend to be pretty dry reads. Researchers, surprise…surprise, write papers to be read by other researchers. Any time you delve into academia to look for answers you have a lot to read and digest, and need a strong jolt of caffeine to keep you going.

Combine that with the fact that the term "Knowledge Management" suffers from rampant buzzword abuse in the same way that the term "Governance" does. This abuse reflects itself in academia where authors are forced to spend pages and pages of their work on defining exactly what they are talking about, whilst making sure that they have demonstrated that they have checked their facts (evidenced by numerous references to other researches).

I ended up finding one particular paper to be very insightful contained within this book:


and in particular, this paper/chapter with an extremely long title…

*Paul takes a deep breath*

"An Empiric Study of Organizational Culture Types and their Relationship with the Success of a Knowledge Management System and the Flow of Knowledge in the U.S. Government and Nonprofit Sectors" by Juan Román-Velázquez, D.Sc.

What a mouthful that was!

Credit where credit is due though, this is a terrific paper and I am going to barely paraphrase it here. But I encourage anyone who wants to ensure that organisational culture issues have been given due consideration in their planing to read this paper. Despite being oriented to government and non-profit organisations, there is a lot of good conclusions to draw from.

Velázquez sets the scene by explaining that public, private, and nonprofit enterprises must survive and thrive in an environment of shrinking distance, complex interdependencies and increased uncertainty. Unsurprisingly, the use of knowledge management (KM) is rapidly growing and tools like SharePoint are commonly used in this area. Velázquez has a good definition for KM that

…provides the capability to engineer the enterprise structure, functions, and processes necessary for the enterprise to survive and prosper. KM leverages the existing human capital/intellectual assets to help generate, capture, organize, and share knowledge that is relevant to the mission of the enterprise. Furthermore, the implementation of a KM system (KMS) enables the effective application of management best practices and information technology tools to deliver the best available knowledge to the right person, at just the right time, to solve a problem, make a decision, capture expertise, and so forth, while performing their work. The KMS can comprise formal systems, processes, management directives, and others that, when combined, help generate, capture, organize, and share available knowledge that is relevant to the mission of the enterprise.

Velázquez than makes the key point that I have always believed. I tell clients that SharePoint is 90% head-space. Velázquez argues although motivations for KM may differ between the public and private sector, the *practice* of knowledge management is very similar. Velázquez also stresses the point that "tools" are a small part of the solution.

A successful KMS involves more than just implementing a new technology that can be acquired in a “box”; it requires understanding and integrating its human aspects and the culture in which it operates.

So SharePoint is not a Knowledge Management System – it is merely one of the tools that underpin a KMS.

Where does organisational culture come from?

A widely held view is that the importance of organisational cultural considerations emerged by the failure of many US and European companies to compete with Japanese firms. Case in point? Look at the history of Ford, General Motors and Toyota. In their book, Diagnosing and Changing Organisation Culture (see below), authors Kim Cameron and Robert Quinn make the point that successful companies with sustained profitability and above-average returns leverage their organisational culture as the key factor for competitive advantage.

Organisational culture can emerge in a number of ways:

  • It is sometimes created by its founder (e.g. Walt Disney).
  • It may emerge over time, as the organization faces challenges and obstacles (e.g. Coca-Cola)
  • It may be developed consciously by the management team (e.g. General Electric through Jack Welch).

How important is organisational culture? Consider this quote from Cameron and Quinn.

The point we are illustrating with these examples is that without another kind of fundamental change, namely, the change of the culture of an organisation, there is little hope of enduring improvement in organisational performance. A primary reason for the failure of so many efforts to improve organisational effectiveness is that, whereas the tools and techniques may be present and the change strategy implemented with vigor, failure occurs because the fundamental culture of the organisation remains the same. Consider the studies by Cameron and his colleagues (Cameron, Freeman, & Mishra, 1991; Cameron, 1992; Cameron, 1995) in which empirical studies were conducted in more than 100 organisations that had engaged in total quality management (TQM) and downsizing as strategies for enhancing effectiveness. The results of those studies were unequivocal. The successful implementation of TQM and downsizing programs, as well as the resulting effectiveness of the organisations’ performance, depended on having the improvement strategies embedded in a culture change. When TQM and downsizing were implemented independent of a culture change, they were unsuccessful. When the culture of these organisations was an explicit target of change, so that the TQM and/or downsizing initiatives were a part of an overall culture change effort, they were successful. Organisational effectiveness increased. Culture change was the key.

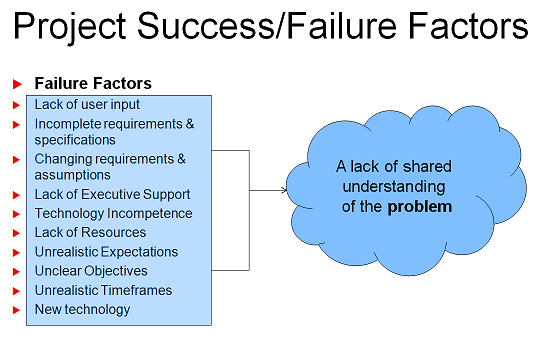
That quote, I think hits the nail on the head of why so many SharePoint projects fail. To implement SharePoint without any appreciation for organisational culture is simply not smart. If you are dumfounded by the fact that nobody in the organisation is embracing wikis, blogs and discussion forums, stop and think about it. Is this organisation conducive to such technologies?

Fortunately for SharePoint practitioners who have never considered the effect that an organisation’s culture has on the application of collaborative technology, I’m about to make your life easier… In short, the hard work has been done for you.

The CVF model

In the first article, I used the learning style theories of Honey and Mumford and Marston DISC to explain how our individual differences impacted on the means and methods by which we collaborate. They are not the only theories by any stretch. In fact, pretty much anytime anybody puts up a theory or methodology, you will invariably find someone else trashing it by questioning its validity. Likewise, when trying to quantify organisational culture factors, there are many different measurement methods with different theoretical underpinnings. Naturally, each believes that *theirs* is the right way to go.

I just had a sudden thought that maybe the learning and behavioural styles of an individual has an influence on which measurement methodology they might find to be the most useful.

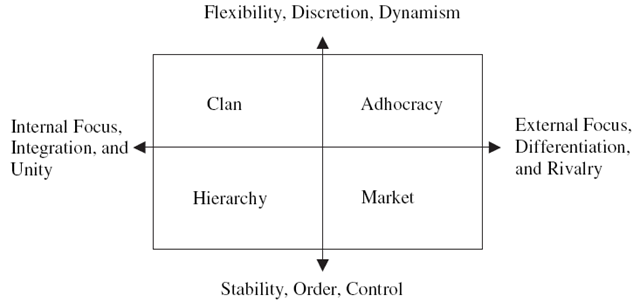
One tool used to diagnose organisations and help executives change their culture is called the Competing Values Framework (CVF). The CVF consists of a framework, a sense-making tool, and a set of steps to analyze and change organisational culture. CVF is best explained with two charts that I have supplied below.


image

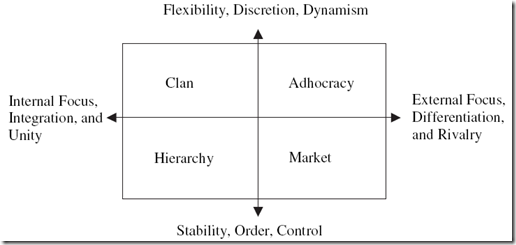
There are two dimensions used in this chart. From left to right, we are looking at "internal versus external" factors such as employee satisfaction, customer service, market share and profitability. From bottom to top, we are looking at the "control versus flexibility" factors such as the internal processes, policies and systems that maintain stability and consistency at one end, and adaptability at the other. Taken together, the two dimensions of the CVF produces four quadrants: Clan, Adhocracy, Hierarchy and Market culture.

Note that it is a very similar dimension based system like Marston DISC. (This is why I like it).

Below I have defined the characteristics of each culture type as defined by Velázquez:

The clan culture: Dominant in flexibility, discretion, dynamism, internal focus, integration and unity.

A very friendly place to work where people share a lot of themselves. It is like an extended family. The leaders, or the heads of the organization, are considered to be mentors and perhaps parent figures. The organization is held together by loyalty or tradition. Commitment is high. The organization emphasizes the long-term benefits of human resources development and attaches great importance to cohesion and morale. Success is defined in terms of sensitivity to customers and concern for people. The organization places a premium on teamwork, participation, and consensus.

The adhocracy culture: Dominant in flexibility, discretion, dynamism, external focus, differentiation and rivalry.

A dynamic, entrepreneurial, and creative place to work. People stick their necks out and take risks. The leaders are considered innovators and risk takers. The glue that holds the organisation together is commitment to experimentation and innovation. The emphasis is on being on the leading edge. The organisation’s long-term emphasis is on growth and acquiring new resources. Success means gaining unique and new products or services. Being a product or service leader is important. The organisation encourages individual initiative and freedom.

The market culture: Dominant in stability, order, control, external focus, differentiation and rivalry.

A results-oriented organisation whose major concern is with getting the job done. People are competitive and goal oriented. The leaders are hard drivers, producers, and competitors. They are tough and demanding. The glue that holds the organisation together is an emphasis on winning. Reputation and success are common concerns. The long-term focus is on competitive action and achievement of measurable goals and targets

The hierarchy culture: Dominant in stability, order, control, internal focus, integration and unity.

A very formalised and structured place to work. Procedures govern what people do. The leaders pride themselves on being good efficent-minded coordinators and organizers. Maintaining a smooth-running organisation is most critical. Formal rules and policies hold the organisation together. The long-term concern is on stability and performance with efficient smooth operations. Success is defined in terms of dependable delivery, smooth scheduling, and low cost. The management of employees is concerned with secure employment and predictability.

I’m sure that just like the previous article, most readers will readily identify the sort of organisational culture to which they belong. Microsoft themselves are a classic case study of an organisation that has attempted to change its culture on numerous occasions with varying degrees of success. Microsoft would like to think that their culture is that of a clan and adhocracy, but the reality is they are very much a market culture. These days they are beaten to the punch my smaller, more nimble competitors, but over the long term they are able to use their formidable market position and financial leverage to succeed. Netscape is a classic example of Microsoft’s market culture succeeding, but you can almost *hear* the rusty gears of the Microsoft culture machine slowly but surely turning as competitors like Google and Linux achieve tremendous success which has been built on very different philosophical foundations.

Having said that, I believe personally that Google is now invariably moving from a strong clan/adhocracy culture starting point to a dominant market culture as well. If you disagree with my assertion then we need to prove it either way. How? 

…Enter the OCAI.

OCAI

The Organisational Culture Assessment Instrument (OCAI) is part of the CVF. It is a survey based instrument that allows an organisation to profile what quadrant they are strongest in and to decide if they would be better off by cultivating strengths in another quadrant. There are plenty of reasons why a company might want to do this. Microsoft both succeeded and failed in this regard. They managed to completely out-compete Netscape through Netscape’s own failed execution of strategy, yet they have been playing catch-up with Google for years and still really have not managed to make a dent. 

To determine the dominant culture type in an organization, survey questions are group into six "cultural components". The six components are: General Dominant Characteristics, Organizational Leadership, Management of Employees, Organizational Glue, Strategic Emphasis and Criteria of Success.

  • General Dominant Characteristics: In general, what does the organisation look like? What the overall organization is like.
  • Organizational Leadership: How leaders are perceived in their direction of the institution.
  • Management of Employees: The style that characterizes how employees are treated and what the working environment is like.
  • Organizational Glue: The bonding mechanisms that hold the organisation together.
  • Strategic Emphasis: Areas of emphasis or priority issues that guide the organisational strategies.
  • Criteria of Success: Evaluation criteria and procedures to determine level of achievements and outcomes. It is how victory is defined and what gets rewarded and celebrated.

Each question has four alternatives representing each CVF quadrant (A=Clan, B=Adhocracy, C=Market, D=Hierarchy). Individuals completing the OCAI are asked to assign a score to each alternative. A higher number of points are given to the alternative that is most similar to the organisation in question. Results of the OCAI survey are obtained by computing the average of the response scores for each alternative. This can then be plotted as per the example below.

image

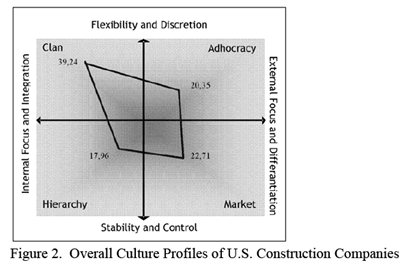
Et Voila! Now we have a much clearer assessment of the culture of an organisation, based on the feedback from the members of the organisation.

Is it worth it?

Geeks who have made it this far through this article are at this point wondering what I am smoking, but rest assured – this stuff is critically important for anybody who is tasked with putting SharePoint into an organisation.

It actually turns out that research using the CVF quadrant has shown that large organisations able to balance their competing values by growing strength in each quadrant tend to outperform other organisations over the long-term. Therefore, the tools and technologies that are put in place to support knowledge management need to also take into account the culture of the organisation in order to extract maximum value from the investment.

Each of the four traits were also significant predicators of other effectiveness criteria such as quality, employee satisfaction, and overall performance. The results also showed that the four traits were strong predicators of subjectively-rated effectiveness criteria for the total sample of firms, but were strong predicators of objective criteria such as return on net-assets and sales growth only for larger firms.

In a following post from this series, I will present the findings of the Velázquez paper which undertook an empirical analysis of KM priorities and critical success factors of many organisations using OCAI.

How would SharePoint look?

In the first article I had a section where I theorised how a SharePoint installation would look like if behavioural types had been taken to extremes. In the interests of consistency, I think it’s good to repeat that experiment in poor stereotyping here:

The clan culture is social networking personified and therefore Facebook style applications are the answer to collaboration and knowledge management. Employees twitter away to each-other and share everything. SharePoint’s "My Sites" are the obvious candidate here, but to a mature clan culture, my-sites are pretty antiquated and almost laughable compared to some of the competing cloud based applications out there. Document libraries? Sheesh! What do you need documents for anyway?  Everyone uses blogs, wikis and Information architecture consists of tagging anything and everything. A mature clan culture would very likely utilise 3rd party add-ins like Newsgators Social Sites if they were to make a SharePoint investment.

I actually believe that anyone who considers themselves a clan culture and is putting in SharePoint is really a market culture with a case of rose coloured glasses 🙂 .

The adhocracy culture is essentially every startup company as well as any CEO who describes themselves as "dynamic". SharePoint, in this type of culture, does not have an information architecture to speak of (in the ‘classic’ meaning of that term). SharePoint features will be used as needed and grow over time. If it works, it will be used, if it does not, it will lie abandoned. Anything newly released will be eagerly tried, kept or discarded depending on relevance and usage. Some re-use from learning will take place, but ultimately SharePoint will perpetually be a work in progress with no central governance authority. Most power users will be administrators of their own sites and any attempts to impose centralised order or a governance regime that is based around centralisation and standards will likely fail. Decentralised control for this type of organisation is fine because there is a strong sense of ownership of the knowledge and information.

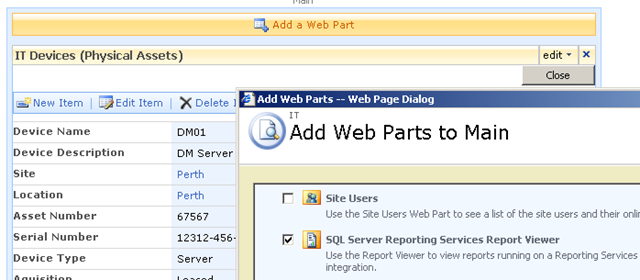
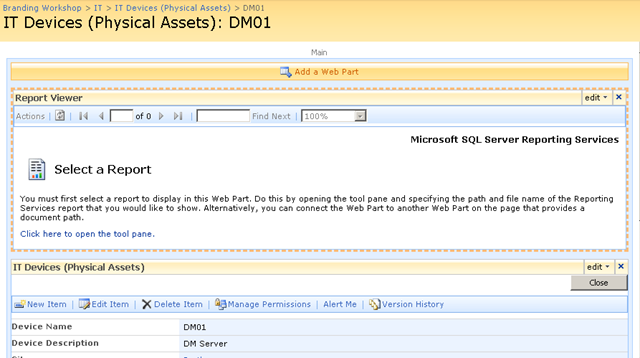
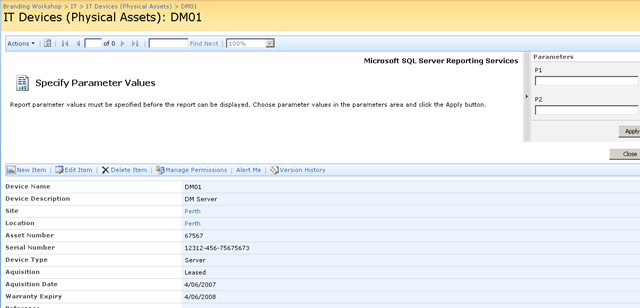
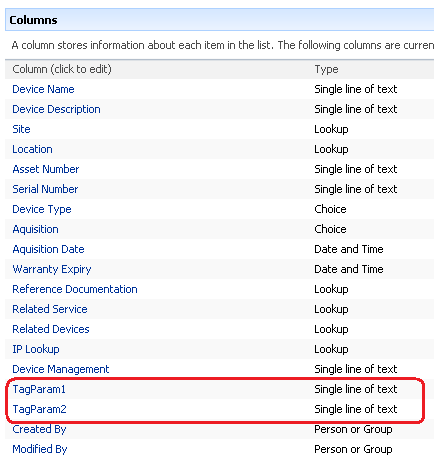
The market culture would start to utilise SharePoint in a manner that is most in keeping with the literature around features, deployment and governance. Dashboards and KPI’s would feature heavily, as well as workflows that contribute to the ease of collecting performance measurements. Reporting Services integration in particular will fare well here. In a market culture, very little sympathy may be given for SharePoint functionality that is not seen as contributing positively to the business. Additionally, users are unlikely to change for the sake of change or because it is something new and shiny. A market driven culture will implement SharePoint because they see a tangible, quantifiable reason to do so.

The hierarchy culture will implement SharePoint in its most ‘classical’ style. They will naturally make use of site collection, sites and subsites and enforce strict, often complex security boundaries with tight centralised control. Chances are that significant time will be invested into ‘classical’ governance such as forming a committee, standardising on structure and conventions and trying to create a solution that is repeatable with a minimum of rework. Workflows will be very popular, as well as form services as well as document centric collaboration. Facebook style social networking will most definitely not be a high priority, and what’s more, will probably be blocked by the corporate firewall anyway!

Another note: SharePoint out of the box in my opinion is most suited to the latter two organisational cultures. Is it any surprise that a market culture organisation such as Microsoft would produce a collaborative tool that happens to work with it’s own organisational culture? Therefore it begs the question whether an organisation founded on one culture can ever really write the perfect tool for another culture?

Culture based communication fragmentation

Just like the first article, I have painted a pretty stereotypical picture of the sort of SharePoint installation I’d likely see. Some readers (dare I risk suggesting younger readers?) may look at the market and hierarchy culture as old school, representing 20th century organisational thinking. Certainly Linux proves that the clan culture can be extremely successful against the old school guys. But there are many stories of organisations that have had massive initial success, only to get left in the dust once the slower market and hierarchical cultures get their act in gear. One thing hierarchical cultures can do exceptionally well is repeat process more consistently, with fewer defects which ultimately reduces cost. They may not be all that quick at first, but it’s not always about being first to market.

Once again I leave you on an Information Architecture note. Someone who only knows a clan culture will very likely put together a SharePoint solution vastly different to someone who has only known hierarchical culture. The prevailing culture will always win the technology battle, no matter how passionate the individuals are. Even organisational stakeholders in a SharePoint project often make this mistake with the "build it and they will come" approach and think that making the technology available will change the culture . This is both naive and dangerous and has the effect of setting yourself up for project failure.

So, you, as an information architect, need to acutely be aware of the prevailing culture. If your stakeholders give you mixed messages, then perhaps the CVF/OCIA analysis would be a very timely and smart thing to do.

Thanks for reading

Paul Culmsee

www.sevensigma.com.au


Root Causes of Communication Fragmentation: Learning styles and behavioural styles

This is the first article in a short series that will be looking at factors causing the sort of communication problems that underpin the motivation to implement a product like SharePoint. When you think about why you want to implement SharePoint, it tends to boil down to an improvement in efficiency brought about by improved collaboration between individuals or teams.

Improved or more effective collaboration is a great idea in theory but unfortunately SharePoint’s implementations have been hit or miss affairs. When a SharePoint project goes well, it tends to go very well. When it goes bad, it tends to be very bad. I’ve seen both extremes. On one of my projects I had the executive chairman so enamoured with a particular requirement being satisfied that he was out there evangelising to the user base for me. Once this happens, success is generally assured. But on the other hand, I have been called out to sites where they have completely lost control of it all, and to even mention the dreaded "S" word will result in you being ostracised.

I realised long ago that to put in SharePoint without considering and understanding the various root causes to "communication problems" is to be unconsciously incompetent. (By the way, if you have not read my "Thinking SharePoint" series, "unconsciously incompetent" is a term used in education/training disciplines to indicate that "you do not know what you do not know". In other words, how can you be trained on something when you do not even acknowledge that you have a deficiency in that area?

Training, therefore, is most effective when trainees are at the "consciously incompetent" stage of their learning. This means that they now realise and understand that they have deficiencies in a knowledge area and seek to improve their skill. Some might argue that to actually put SharePoint into an organisation is to be consciously incompetent, because you have recognised the inefficiency in existing communication and collaboration. I believe this is deluded because all you are doing is trying to deal with the visible effects of communication fragmentation. You still do not necessarily have a full understanding of the root causes of that fragmentation.

image

I’m sure that many of you have watched the TV series House. How many times do they just about kill the patient with a treatment for an incorrect diagnosis? Unlike Dr House, though, SharePoint consultants don’t often get that convenient epiphany at the 38 minute mark of an episode that nails the root cause, applying the correct treatment and saving the patient.

Therefore, I have decided to call this series "Root causes of communication fragmentation". This first article is essentially the same as one called Learning styles, behavioural styles and “collaboration” that I published it over at endusersharepoint.com.

Honey and Mumford Learning Styles

When I was taking my "Train the trainer" course at the Australian Institute of Management, we participated in an experiment. We answered a questionnaire and based on our answers were separated into four groups.

It turned out that these groups were separated based on our most dominant Honey and Mumford learning style.

For those of you who are not aware, according to this work, there are four types of learners. I have listed them below, and for your reference I was classed as a theorist/pragmatist with more of a pragmatic leaning. Funnily enough when I was younger I was definitely an activist learner but as I have aged I moved down the list!

Activitists (Do)

  • Immerse themselves fully in new experiences
  • Enjoy here and now
  • Open minded, enthusiastic, flexible
  • Act first, consider consequences later
  • Seek to centre activity around themselves

Reflectors (Review)

  • Stand back and observe
  • Cautious, take a back seat
  • Collect and analyze data about experience and events, slow to reach conclusions
  • Use information from past, present and immediate observations to maintain a big picture perspective.

Theorists (Conclude)

  • Think through problems in a logical manner, value rationality and objectivity
  • Assimilate disparate facts into coherent theories
  • Disciplined, aiming to fit things into rational order
  • Keen on basic assumptions, principles, theories, models and systems thinking

Pragmatists (Plan)

  • Keen to put ideas, theories and techniques into practice
  • Search new ideas and experiment
  • Act quickly and confidently on ideas, gets straight to the point
  • Are impatient with endless discussion

In this experiment, each of the four groups were given the same fictitious problem. We were asked to write a plan for how we would go about solving it. We spent then 30 minutes on this in groups before reassembling back in the same room where the groups compared notes.

Perhaps unsurprisingly, we all thought that the other groups were complete idiots. The reflectors in particular thought that the activists represented complete anarchy and chaos. My group – the pragmatists (who of course have it right), knew that their method was by far the best one and had no time at all for reflectors who perform all of that analysis-paralysis. Mind you, we did have some sympathy for the theorists 🙂 .

Why is communication, shared understanding, knowledge management and collaboration such a difficult thing to do?  This is one of the root causes. This experiment really hit home to me, just how incredibly different people are and how a collaborative tool by definition, needs to be designed or implemented in such a way that all participants use, believe and evangelise it. But since they all have different styles of learning, accommodating them all without alienating some is a pretty difficult task.

DISC

Then we have behavioural theory with Marston DISC. This test is used in recruitment and HR often to see how well a candidate will ‘fit’ into the cohesiveness of a group or organisation. DISC is an acronym that relates to four ‘dimensions’ of personality traits.

  • Dominance – relating to control, power and assertiveness
  • Influence – relating to social situations and communication
  • Steadiness – relating to patience, persistence, and thoughtfulness
  • Conscientiousness – relating to structure and organization

Below is the explanation of each trait from wikipedia. Is it any surprise that senior managers tend to be dominant in "D", sales and marketing people dominant "I" while engineers are dominant "C"?

  • Dominance: People who score high in the intensity of the ‘D’ styles factor are very active in dealing with problems and challenges, while low D scores are people who want to do more research before committing to a decision. High "D" people are described as demanding, forceful, egocentric, strong willed, driving, determined, ambitious, aggressive, and pioneering. Low D scores describe those who are conservative, low keyed, cooperative, calculating, undemanding, cautious, mild, agreeable, modest and peaceful.
  • Influence: People with High I scores influence others through talking and activity and tend to be emotional. They are described as convincing, magnetic, political, enthusiastic, persuasive, warm, demonstrative, trusting, and optimistic. Those with Low I scores influence more by data and facts, and not with feelings. They are described as reflective, factual, calculating, skeptical, logical, suspicious, matter of fact, pessimistic, and critical.
  • Steadiness: People with High S styles scores want a steady pace, security, and do not like sudden change. Low S intensity scores are those who like change and variety. High S persons are calm, relaxed, patient, possessive, predictable, deliberate, stable, consistent, and tend to be unemotional and poker faced. People with Low S scores are described as restless, demonstrative, impatient, eager, or even impulsive.
  • Conscientious: Persons with High C styles adhere to rules, regulations, and structure. They like to do quality work and do it right the first time. High C people are careful, cautious, exacting, neat, systematic, diplomatic, accurate, tactful. Those with Low C scores challenge the rules and want independence and are described as self-willed, stubborn, opinionated, unsystematic, arbitrary, and careless with details.

Don Bowlby has a nice post where he illustrates these different behavioural styles with examples of "Dominant Dave", "Influential Ingrid", "Steady Stan" and "Conscientious Catherine". Do take the time to read his post, and then see which of these people you relate to the most.

Note: You can have elements of more than one of the DISC dimensions but you tend to be dominate in one of them.

Dominant Dave questions the status quo, is quick to make decisions/solve problems. He has no problem with power and authority, loves autonomy and working on lots of stuff. He struggles to relate to some people and sometimes has trouble identifying with the group. People like Dave get things moving forward, but can overlook detail in the process.

Influential Ingrid always wants to make a good impression, loves people and prefers to talk about her ideas rather than present them in writing. She doesn’t like a lot of details and can appear disorganized. Being so emotionally oriented, she can have trouble making objective evaluations of people and situations. People like Ingrid foster open communication and strive for an enjoyable experience. But Ingrid needs people who enjoy routines and tasks because these things make her uncomfortable.

Steady Stan is patient, helpful and finishes everything he starts. Stan’s daily routine rarely changes and he does not react well if it suddenly does. Without people like Stan, things would never get finished, yet the rigidity of Stan’s routine can frustrate when quick decisions and action are needed.

Conscientious Catherine is even more anal-retentive than Steady Stan. She is very analytical, applies critical thinking and likes to know what the goals are and what is expected and is always happy to lend her expertise when required. Sometimes Catherine’s detail oriented nature can slow projects down and her application of critical thinking may seem negative at times. She has a knack for pointing out everything that can go wrong with a project, product or venture.

Hmm, I just read a book on analytics and wrote a series of posts on SharePoint project failure and ROI – but I am as messy as hell so which domain am I? 😉

How would SharePoint look?

Let’s try a little experiment. Below I theorise what a SharePoint portal would look like, based on the presumption that each of our 4 people above assumed full creative control over development and direction. Feel free to comment to the accuracy (or not) of my guesses.

Dominant Dave has seen SharePoint, liked it and thrown together a SharePoint site. He has set up sites, wiki’s, blogs, lists, libraries and on top of that, relentlessly downloaded every possible add-on, and tried it out, using some and giving up on others (but never uninstalled). His idea of a communications plan and training is to send out an email with the new URL and instruct people to start using it. The site is full of evidence of half-starts and unfinished ideas and no-one really knows exactly what the goal of it all is. But that’s okay, Dave has by now passed it onto Steady Stan to finish it off anyway.

Influential Ingrid on the other hand, engages a graphic design company to work on the look of the site. She will come up with a catchy acronym for the project, and organise t-shirts and mouse-mats to be printed and distributed to staff. The site is launched with great fanfare, yet practically devoid of content except for the social club site and the "about us" section. Document libraries and lists are unlikely to have much attention, because all the emphasis is on the static web content side of things. Despite the lack of use of many of the built-in collaborative tools, boy-oh-boy, does that home page look cool! Things will flash, sparkle and dazzle more than a drag queen singing at a cabaret.

Steady Stan will quickly see the potential for improving the way that content can be better organised, searched and managed. Thus he will spend his time coming up with a common structure for all aspects of the portal no matter which site is visited. The document libraries, list and other content areas will be consistent and identical and templated for re-use. Branding will be ignored, because it is not as important as consistency. He will roll it out, expecting people to naturally take it up, seeing the value created.

Conscientious Catherine will first undertake a 6 month feasibility study into the portal that costs more money than what Dominant Dave took for his entire SharePoint project. The outcome of this study would be to learn what people want out of the portal. She works out a methodology to gather requirements, but on execution it becomes obvious that both Dave and Ingrid haven’t got a clue as they can’t seem to offer a straight answer when she asks what they want. "How can I deliver you a portal when I don’t know your requirements?", Catherine asks in indignation. In the end, Dominant Dave looks at how much money has been spent for no obvious gain and kills the project.

The Honey DISC soup

The point of my little exercise with sweeping generalisation is that "collaboration" by definition is about working together to achieve a common goal or outcome. Unfortunately, it is clear that our 4 characters above have very different motivations and interpretations of what that outcome is.

In my consulting life, where I spend a lot of time doing requirements work, training or project management, I have gotten to the point where I can pick someone’s personality/learning style out. Also, once you start to get a feel for this, you realise that a lot of root causes in social fragmentation is simply a lack of awareness of how people speak to each other.

When you combine DISC and learning styles, it gives you a pretty good appreciation of social complexity. Given a complex problem, you will always get people who want to jump straight in (activists), those who want to consider all of the issues (reflectors), theorists who will be looking for best-practice guidelines and us pragmatists who say the rest are right so long as it is done *our* way.

But when you add the dimension of DISC, the forces of social fragmentation get even stronger. Consider the case of a "Dominant Activist". Here is someone who is forceful, strong willed, potentially intimidating yet wants to dive headlong into a solution. These guys are hazardous to your health because they usually have the power to do it their way regardless.

On the other extreme you have a "Conscientious Reflector". There is every dodgy middle manger that I have worked with right there!

Another classic example is the "Steady Theorist" who believe that rigidly following a methodology is the answer to the world’s problems, no matter what. I have met a few ITIL people who I would lump in this bucket 🙂 .

Communication Fragmentation

Meetings are the place where fragmentation strikes and miscommunication arises as a result. For example, in a strategy meeting, the reflector is the one who *always* challenges the frame of the meeting and annoys everybody else in the process. The activists are annoyed that they had to go to the meeting in the first place, and the theorists are trying to convince everyone that [insert methodology here] is the way to go.

A dominant "D" type personality often speaks in a very direct manner. To a low D type personality, this can be seen as intimidating, rude or arrogant. D and S type personalities can really struggle to get along, because at times, they are polar opposites in what motivates them and keeps them interested.

A heavy "D" personality who is a pragmatic learner is probably going to be a handful when it comes to, say, working on functional requirements with an "S" type application developer who happens to be a theorist learner.

Is it any wonder people consider meetings to be inefficient, a waste of time and not achieving much!

The point is that usually people forget that not everybody shares their behaviour and learning styles.

Collaboration Fragmentation and Information Architecture

So since meetings are inefficient and suck so much, we look to other methods to collaborate to achieve our goals. But that communication gap that can exist between people of differing learning styles and personality types reflects itself in collaborative tools as well. An IT Manager who, for example, is mainly a "S" type personality is going to put together a SharePoint solution with a very different emphasis than, say, someone who is mainly a Dominant Activist.

Of course, organisational type and culture, regional culture, geography, age, gender and other biases play large factors as well. Organisational considerations has gained some attention – one of the best examples I saw being the great paper by Michael Earl who in 2001 wrote "Knowledge Management Strategies – Toward a taxonomy". But unfortunately, no academic has ever performed an empirical study that looks at whether there is a correlation between behaviour/learning styles and the sort of collaborative tools/techniques that people gravitate to. I think if such a study was undertaken, it would offer some extremely valuable insights into how to go about delivering a collaborative solution for particular groups, individuals or organisations.

So, when you are designing your "work of art" Information Architecture that has taken weeks to work out, ask yourself this question: Is this a work of art for me or for the people who will be collaborating via it?

The great irony in all of this is that the only way to remove some of the barriers of social fragmentation is to collaborate. In the case of SharePoint, you need to collaborate, to put in a collaborative platform. Am I the only one who finds that perversely funny? 🙂

Paul Culmsee

www.sevensigma.com.au


It’s all in the way you ask the question…

(Nerds are going to find this post dead boring).

Before I start, let me state that I am a believer in the Honey and Mumford theory of learning styles, as well as the Marston DISC assessment. I think both are closely related, and go some way to explaining many mysteries of the world like – "Why are there Metrosexuals?", "Why doesn’t everyone listen to Opeth?" and most importantly of all "What goes on in the strange world that is the engineer mind"?

"Engineer mind"?

Don’t bother googling that term because I made my own definition. I’m really referring to tech nerds generally, but the definition actually extends beyond nerds to a certain type of personality that tends to be a combination of an Activist learning style with a Steady/Conscientious DISC profile.

The point is that engineer minded people live in a factual world. Questions are factual and answers are usually pretty absolute. An engineer’s dogma also has a way to make facts more ‘factual’ in their eyes as well.

For a chunk of the rest of humanity, factual questions are not quite that factual. In many contexts, particularly political ones, a factual question is often open to more liberal interpretation.

This is in essence why engineers dress badly and sales people commonly exhibit metrosexual tendencies. 🙂


Continue reading “It’s all in the way you ask the question…”


Complexity bites: When SharePoint = Risk

I think as you age, you become more and more like your parents. Not so long ago I went out paintballing with some friends and we all agreed that the 16-18 year olds who also happened to be there were all obnoxious little twerps who needed a good kick in the rear. At the same time, we also agreed that we were just as obnoxious back when we were that age. Your perspective changes as you learn and your experience grows, but you don’t forget where you came from.

I now find myself saying stuff to my kids that my parents said to me, I think today’s music is crap, I have taken a liking to drinking quality scotch. Essentially all I need now to complete the metamorphosis to being my father is for all my hair to fall out!

So when I write an article whining about an assertion that IT has a credibility issue and has gone backwards in its ability to cope with various challenges, I fear that I have now officially become my parents. I’ll sound like grandpa who always tells you that life was so much simpler back in the 1940’s.

Consequences of complexity…

Before I go and dump on IT as a discipline, how about we dump on finance as a discipline, just so you can be assured that my cynicism extends far beyond nerds.

I previously wrote about how Sarbanes Oxley legislation was designed to, yet ultimately failed to, provide assurance to investors and regulators that public companies had adequate controls over their financial risk. As I write this, we are in the midst of a once in a generation-or-two credit crisis where some seven hundred billion dollars ($700,000,000,000) of US taxpayers’ money will be used to take ownership of crap assets (foreclosed or unpaid mortgages).

Part of the problem with the credit crisis was through the use of "collateralized debt obligations". This is a fancy, yet complex, way of taking a bunch of mortgages, and turning them into an "asset" that someone else who has some spare cash invests in. If you are wondering why the hell someone would invest in such a thing, then consider people with home loans, supposedly happily paying interest on those mortgages. It is that interest that finds its way to the holder (investor) of the CDO. So a CDO is supposedly an income stream.

Now if that explanation makes your eyes glaze over then I have bad news for you: that’s supposed to be the easy part. The reality is that the CDO’s are actually extremely complex things. They can be backed by residential property, commercial property, something called mortgage backed securities, corporate loans – essentially anything that someone is paying interest on can find its way into a CDO that someone else buys into, to get the income stream from the interest paid.

To provide "assurance" that these CDO’s are "safe", ratings agencies give them a mark that investors rely upon when making their investment. So a "AAA" CDO is supposed to have been given the tick of approval by experts in debt instrument style finance.

Here’s the rub about rating agencies. Below is a news article from earlier in the year with some great quotes

http://www.nytimes.com/2008/03/23/business/23how.html?pagewanted=print

Credit rating agencies, paid by banks to grade some of the new products, slapped high ratings on many of them, despite having only a loose familiarity with the quality of the assets behind these instruments.

Even the people running Wall Street firms didn’t really understand what they were buying and selling, says Byron Wien, a 40-year veteran of the stock market who is now the chief investment strategist of Pequot Capital, a hedge fund. “These are ordinary folks who know a spreadsheet, but they are not steeped in the sophistication of these kind of models,” Mr. Wien says. “You put a lot of equations in front of them with little Greek letters on their sides, and they won’t know what they’re looking at.”

Mr. Blinder, the former Fed vice chairman, holds a doctorate in economics from M.I.T. but says he has only a “modest understanding” of complex derivatives. “I know the basic understanding of how they work,” he said, “but if you presented me with one and asked me to put a market value on it, I’d be guessing.”

What do we see here? How many people really *understand* what’s going on underneath the complexity?

Of course, we now know that many of the mortgages backing these CDO’s were made to people with poor credit history, or with a high risk of not being able to pay the loans back. Jack up the interest rate or the cost of living and people foreclose or do not pay the mortgage. When that happens en masse, we have a glut of houses for sale, forcing down prices, lowering the value of the assets, eliminating the "income stream" that CDO investors relied upon, making them pretty much worthless.

My point is that the complexity of the CDO’s were such that even a guy with a doctorate in economics only had a ‘modest understanding’ of them. Holy crap! If he doesn’t understand it then who the hell does?

Thus, the current financial crisis is a great case study in the relationship between complexity and risk.

Consequences of complexity (IT version)…

One thing about doing what I do, is that you spent a lot of time on-site. You get to see the IT infrastructure  and development at many levels. But more importantly, you also spend a lot of time talking to IT staff and organisation stakeholders with a very wide range of skills and experience. Finally and most important of all, you get to see first hand organisational maturity at work.

My conclusion? IT is completely f$%#ed up across all disciplines and many will have their own mini equivalent of the US $700 billion dollar haemorrhage. Not only that, it is far worse today than it previously was – and getting worse! IT staff are struggling with ever accelerating complexity and the "disconnect" between IT and the business is getting worse as well. To many businesses, the IT department has a credibility problem, but to IT the feeling is completely mutual 🙂

You can find a nice thread about this topic on slashdot. My personal favourite quote from that thread is this one

Let me just say, after 26 years in this business, of hearing this every year, the systems just keep getting more complex and harder to maintain, rather than less and easier.

Windows NT was supposed to make it so anyone who could use Windows could manage a server.

How many MILLION MSCEs do we have in the world now?

Storage systems with Petabytes of data are complex things. Cloud computing is a complex thing. Supercomputing clusters are complex things. World-spanning networks are complex things.

No offense intended, but the only people who think things are getting easier are people who don’t know how they work in the first place

Also there is this…

There are more software tools, programming languages, databases, report writers, operating systems, networking protocols, etc than ever before. And all these tools have a lot more features than they used to. It’s getting increasingly harder to know "some" of them well. Gone are the days when just knowing DOS, UNIX, MVS, VMS, and OS/400 would basically give you knowledge of 90% of the hardware running. Or knowing just Assembly/C/Cobol/C++ would allow you to read and maintain most of the source code being used. So I would argue that the need for IT staff is going to continue to increase.

I think the "disconnect" between IT and Business has a lot more to do with the fact that business "knows" they depend on IT, but they are frustrated that IT can’t seem to deliver what they want when they want it. On the other side, IT has to deal with more and more tools and IT staff has to learn more and more skills. And to increase frustration in IT, business users frequently don’t deliver clear requirements or they "change" their mind in the middle of projects….

So it seems that I am not alone 🙂

I mentioned previously that more often than not, SQL Server is poorly maintained – I see it all the time. Yet today I was speaking to a colleague who is a storage (SAN) and VMware virtualisation god. I asked him what the average VMware setup was like and his answer was similar to my SQL Server and SharePoint experience. In his experience, most of them were sub-optimally configured, poorly maintained, poorly documented and he could not provide any assurance as to the stability of the platform.

These sorts of quality assurance issues are rampant in application development too. I see the same thing most definitely in the security realm too.

As the above quote sates, "it’s increasingly harder to know *some* of them well". These days I am working with specialists who live and breathe their particular discipline (such as storage, virtualisation, security or comms). Those disciplines over time grow more complex and sub-disciplines appear.

Pity then, the poor developer/sysadmin/IT manager who is trying to keep a handle on all of this and try to provide a decent service to their organisation!

Okay, so what? IT has always been complex – I sound like a Gartner cliche. What’s this got to do with SharePoint?

Consequences of SharePoint complexity…

SharePoint, for a number of reasons, is one of those products that has a way of really laying bare any gaps that the organisation has in terms of their overall maturity around technology and strategy.

Why?

Because it is so freakin’ complex! That complexity transcends IT disciplines and goes right to the heart organisational/people issues as well.

It’s bad enough getting nerds to agree on something, let alone organisation-wide stakeholders!

Put simply, if you do a half-arsed job of putting SharePoint in, you will be punished in so many ways! The simple fact is that the odds are against you before you even start because it only takes a mistake in one particular part of the complex layers of hardware, systems, training, methodology, information architecture and governance, to devalue the whole project.

When I first started out, I was helping organizations get SharePoint installed. However lately I am visiting a lot of sites where SharePoint has already been installed, but it has not been a success. There are various reasons;I have cited them in detail in the project failure series, so I won’t rehash all that here. (I’d suggest reading parts three, four and five in particular).

I am firmly of the conclusion that much of SharePoint is more art than science, and what’s more, the organisation has to be ready to come with you. Due to differing learning styles and poor communication of strategy, this is actually pretty rare. Unfortunately, IT are not the people who are well suited to "getting the organisation ready for SharePoint."

If that wasn’t enough, then there is this question. If IT already struggle to manage the underlying infrastructure and systems that underpin SharePoint, then how can you have any assurance that IT will have a "governance epiphany" and start doing things the right way?

This translates to risk, people! I will be writing all about risk in a similar style to the CFO Return on Investment series very soon. I am very interested in methods to quantify the risk brought about by the complexity of SharePoint and the IT services it relies on. For me, I see a massive parallel from the complexity factor in the current financial crisis and I think that a lot can be learned from it. SOX was supposed to provide assurance and yet did nothing to prevent the current crisis. Therefore, SOX represents a great example of mis-focused governance where a lot of effort can be put in for no tangible gain.

A quick test of "assurance"…

Governance is like learning to play the guitar. It takes practice, and it does not give up its secrets easily and despite good intent, you will be crap at it for a while. It is easy to talk about, but putting it into practice is another thing.

Just remember this. The whole point of the exercise is to provide *assurance* to stakeholders. When you set any rule, policy, procedure, standard (or similar), just ask yourself: Does this provide me the assurance I need that gives me confidence to vouch for the service I am providing? Just because you may be adopting ITIL principles, does *not* mean that you are necessarily providing the right sort assurance that is required.

I’ll leave you with a somewhat biased, yet relatively easy litmus test that you can use to test your current level of assurance.

It might be simplistic, but if you are currently scared to apply a service pack to SharePoint, then you might have an assurance issue. 🙂


Thanks for reading


Paul Culmsee

www.sevensigma.com.au


"Ain’t it cool?" – Integrating SharePoint and real-time performance data – Part 2

Hi again

This article is the second half of a pair of articles explaining how I integrated real-time performance data with an SharePoint based IT operational portal, designed around the principle of passive compliance with legislative or organisational controls.

In the first post, I introduced the PI product by OSIsoft, and explained how SQL Reporting services is able to generate reports from more than just SQL Server databases. I demonstrated how I created a report server report from performance data stored in the PI historian via an OLE DB provider for PI, and I also demonstrated how I was able to create a report that accepted a parameter, so that the output of the report could be customised.

I also showed how a SharePoint provides a facility to enter parameter data when using the report viewer web part.

We will now conclude this article by explaining a little about my passively compliant IT portal, and how I was able to enhance it with seamless integration with the real-time performance data stored in the PI historian.

Just to remind you, here is my conceptual diagram in "acoustic Visio" format

The IT portal

This is the really ultra brief explanation of the thinking that went into my IT portal

I spent a lot of time thinking about how critical IT information could be stored in SharePoint to achieve the goals of quick and easy access to information, make tasks like change/configuration management more transparent and efficient, as well as capture knowledge and documentation. I was influenced considerably by ISO17799 as it was called back then, especially in the area of asset management. I liked the use of the term "IT Assets" in ISO17799 and the strong emphasis on ownership and custodianship.

ISO defined asset as "any tangible or intangible thing that has value to an organization". It maintained that "…to achieve and maintain appropriate protection of organizational assets. All assets should be accounted for and have a nominated owner. Owners should be identified for all assets and the responsibility for the maintenance of appropriate controls should be assigned. The implementation of specific controls may be delegated by the owner as appropriate but the owner remains responsible for the proper protection of the assets."

That idea of delegation is that an owner of an asset can delegate the day-to-day management of that asset to a custodian, but the owner still bears ultimate responsibility.

So I developed a portal around this idea, but soon was hit by some constraints due to the broad ISO definition of an asset. Since assets have interdependencies, geeks have a tendency to over-complicate things and product a messy web of interdependencies. After some trial and error, as well as some soul searching I was able to come up with a 3 tier model that worked.

I changed the use of the word "asset", and split it into three broad asset types.

  • Devices (eg Server, SAN, Switch, Router, etc)
  • IT Services (eg Messaging, Databases, IP Network, etc)
  • Information Assets (eg Intranet, Timesheets,
image

The main thing to note about this model is to explain the different between an IT Service and an Information Asset. The distinction is in the area of ownership. In the case of an "Information Asset", the ownership of that asset is not IT. IT are a service provider, and by definition the IT view of the world is different to the rest of the organisation. An "IT Service" on the other hand, is always owned by IT and it is the IT services that underpin information assets.

So there is a hierarchical relationship there. You can’t have an information asset without an IT service providing it. Accountabilities are clear also. IT own the service, but are not responsible for the information asset itself – that’s for other areas of the organisation. (an Information Asset can also depend on other information assets as well as many IT services.

While this may sound so obvious that its not worth writing, my experience is that IT department often view information assets and the services providing those assets as one and the same thing.

Devices and Services

So, as an IT department, we provide a variety of services to the organisation. We provide them with an IP network, potentially a voice over IP system, a database subsystem, a backup and recovery service, etc.

It is fairly obvious that each IT service consists of a combination of IT devices (and often other IT services). an IP network is an obvious one and a basic example. The devices that underpin the "IP Network" service are routers, switches and wireless access points.

For devices we need to store information like

  • Serial Number
  • Warranty Details
  • Physical Location
  • Vendor information
  • Passwords
  • Device Type
  • IP Address
  • Change/Configuration Management history
  • IT Services that depend on this device (there is usually more than 1)

For services, we need to store information like

  • Service Owner
  • Service Custodian
  • Service Level Agreement (uptime guarantees, etc)
  • Change/Configuration Management history
  • IT Devices that underpin this service (there is usually more than 1)
  • Dependency relationships with other IT services
  • Information Assets that depend on this IT service

Keen eyed ITIL practitioners will realise that all I am describing here is a SharePoint based CMDB. I have a site template, content types, lists, event handlers and workflows that allow the above information to be managed in SharePoint. Below is three snippets showing sections of the portal, drilling down into the device view by location (click to expand), before showing the actual information about the server "DM01"

image image

image

Now the above screen is the one that I am interested in. You may also notice that the page above is a system generated page, based on the list called "IT Devices". I want to add real-time performance data to this screen, so that as well as being able to see asset information about a device, I also want to see its recent performance.

Modifying a system page

I talked about making modifications to system pages in detail in part 3 of my branding using Javascript series. Essentially, a system page is an automatically generated ASPX page that SharePoint creates. Think about what happens each time you add a column to a list or library. The NewForm.aspx, Editform.Aspx and Dispform.aspx are modified as they have to be rebuild to display the new or modified column.

SharePoint makes it a little tricky to edit these pages on account of custom modifications running the risk of breaking things. But as I described in the branding series, using the ToolPaneView hack does the job for us in a safe manner.

So using this hack, I was able to add a report viewer web part to the Dispform.aspx of the "IT devices" list as shown below.

image image

imageimage

Finally, we have our report viewer webpart, linked to our report that accesses PI historian data. As you can see below, the report that I created actually is expecting two parameters to be supplied. These parameters will be used to retrieve specific performance data and turn it into a chart.

image

Web Part Connection Magic

Now as it stands, the report is pretty much useless to us in the sense that we have to enter parameters to it manually, to get it to actually present us the information that we want. But on the same page as this report is a bunch of interesting information about a particular device, such as its name, IP Address, location and description. Wouldn’t it be great if we could somehow pass the device name (or some other device information) to the report web part automatically.

That way, each time you opened up a device entry, the report would retrieve performance information for the device currently being viewed. That would be very, very cool.

Fortunately for us it can be easily done. The report services web part, like many other web parts is connectable. This means that it can accept information from other web parts. This means that it is possible to have the parameters automatically passed to the report! 

Wohoo!

So here is how I am going to do this. I am going to add two new columns to my device list. Each column will be the parameter passed to the report. This way, I can tailor the report being generated on a device by device basis. For example, for a SAN device I might want to report on disk I/O, but a server I might want CPU. If I store the parameter as a column, the report will be able to retrieve whatever performance data I need.

Below shows the device list with the additional two columns added. the columns are called TAGPARAM1 and TAGPARAM2. The next screen below, shows the values I have entered for each column against the device DM01. These values will be passed to the report server report and used to find matching performance data.

image image

So the next question becomes, how do I now transparently pass these two parameters to the report? We now have the report and the parameters on the same page, but no obvious means to pass the value of TagParam1 and TagParam2 to the report viewer web part.

The answer my friends, is to use a filter web part!

Using the toolpane view hack, we once again edit the view item page for the Device List. We now need to add two additional web parts (because we have two parameters). Below is the web part to add.

image

The result should be a screen looking like the figure below

image

Filter web parts are not visible when a page is rendered in the browser. They are instead used to pass data between other web parts. There are various filter web parts that work in different ways. The Page Field filter is capable of passing the value of any column to another web part.

Confused? Check out how I use this web part below…

The screen above shows that the two Page Field filters web parts are not configured. They are prompting you to open the tool pane and configure them. Below is the configuration pane for the page field filter. Can you see how it has enumerated all of the columns for the "IT device" list? In the second and third screen we have chosen TagParam1 for the first page filter and TagParam2 for the second page filter web part.

image image image

Now take a look at the page in edit mode. The page filters now change display to say that they are not connected. All we have done so far is tell the web parts which columns to grab the parameter values from

image

Almost Home – Connecting the filters

So now we need to connect each Page Field filter web part to the report viewer web part. This will have the effect of passing to the report viewer web part, the value of TagParam1 and TagParam2. Since these values change from device to device, the report will display unique data for each device.

To to connect each page filter web part you click the edit dropdown for each page filter. From the list of choices, choose "Connections", and it will expand out to the choice of "Send Filter Values To". If you click on this, you will be promoted to send the filter values to the report viewer web part on the page. Since in my example, the report viewer web part requires two parameters, you will be asked to choose which of the two parameters to send the value to.

image image

Repeat this step for both page filter web parts and something amazing happens, we see a performance report on the devices page!! The filter has passed the values of TagParam1 and tagParam2 to the report and it has retrieved the matching data!

image

Let’s now save this page and view it in all of its glory! Sweet eh!

image 

Conclusion (and Touchups)

So let’s step back and look at what we have achieved. We can visit our IT Operations portal, open the devices list and immediately view real-time performance statistics for that device. Since I am using a PI historian, the performance data could have been collected via SNMP, netflow, ping, WMI, Performance Monitor counters, a script or many, many methods. But we do not need to worry about that, we just ask PI for the data that we want and display it using reporting services.

Because the parameters are stored as additional metadata with each device, you have complete control over the data being presented back to SharePoint. You might decide that servers should always return CPU stats, but a storage area network return disk I/O stats. It is all controllable just by the values you enter into the columns being used as report parameters.

The only additional thing that I did was to use my CleverWorkArounds Hide Field Web Part, to subsequently hide the TagParam1 and TagParam2 fields from display, so that when IT staff are looking at the integrated asset and performance data, the ‘behind the scenes’ glue is hidden from them.

So looking at this from a IT portal/compliance point of view, we now have an integrated platform where we can:

  • View device asset information (serial number, purchase date, warranty, physical location)
  • View IT Service information (owners, custodians and SLA’s)
  • View Information Asset information (owners, custodians and SLA’s)
  • Understand the relationships between devices, services and information assets
  • Access standards, procedures and work instructions pertaining to devices, services and information assets
  • Manage change and configuration management for devices, services and information assets
  • Quickly and easily view detailed, real time performance statistics of devices

All in all, not a bad afternoons work really! And not one line of code!

As i said way back at the start of the first article, this started out as a quick idea for a demo and it seems to have a heck of a lot of potential. Of course, I used PI but there is no reason why you can’t use similar techniques in your own IT portals to integrate your operational and performance data into the one place.

I hope that you enjoyed this article and I look forward to feedback.

<Blatant Plug>Want an IT Portal built in passive compliance? Then let’s talk!</Blatant Plug>

cheers

Paul Culmsee


OSISoft addendum

Now someone at OSISoft at some point will read this article and wonder why I didn’t write about RTWebparts. Essentially PI has some web parts that can be used to display historian data in SharePoint. There were two reasons why I did not mention them.

  1. To use RTWebparts you have to install a lot of PI components onto your web front end servers. Nothing wrong with that, but with Report Services, those components only need to go onto the report server. For my circumstances and what I had to demonstrate, this was sufficient.
  2. This post was actually not about OSISoft or PI per se. It was used to demonstrate how it is possible to use SharePoint to integrate performance and operational information into one integrated location. In the event that you have PI in your enterprise and want to leverage it with SharePoint, I suggest you contact me about it because we do happen to be very good at it 🙂


"Ain’t it cool?" – Integrating SharePoint and real-time performance data – Part 1

Hi

This is one of those nerdy posts in the category of "look at me! look at me! look at what I did, isn’t it cool?". Normally application developers write posts like this, demonstrating some cool bit of code they are really proud of. Being only a part-time developer and more of a security/governance/compliance kind of guy, my "aint it cool" post is a little different.

So if you are a non developer and you are already tempted to skip this one, please reconsider. If you are a CIO, IT manager, Infrastructure manager or are simply into ITIL, COBiT or compliance around IT operations in general, this post may have something for you. It offers something for knowledge managers too. Additionally it gives you a teensy tiny glimpse into my own personal manifesto of how you can integrate different types of data to achieve the sort of IT operational excellence that is a step above where you may be now.

Additionally, if you are a Cisco nerd or an infrastructure person who has experience with monitoring, you will also find something potentially useful here.

In this post, I am going to show you how I leveraged three key technologies, along with a dash of best practice methodology to create an IT Portal that I think is cool.

The Premise – "Passive Compliance"

In my career I have filled various IT roles and drunk the kool-aid of most of the vendors, technologies, methodologies and practices. Nowadays I am a product of all of these influences, leaving me slightly bitter and twisted, somewhat of a security nerd, but at the same time fairly pragmatic and always mindful of working to business goals and strategy.

One or the major influences to my current view of the world, was a role working for OSI Software from 2000-2004, via a former subsidiary company called WiredCity. OSISoft develop products in the process control space, and their core product is a data historian called PI. At WiredCity, we took this product out of the process control market and right into the IT enterprise and OSISoft now market this product as "IT Monitor". I’ll talk about PI/IT monitor in detail in a moment, but humour me and just accept my word that it is a hellishly fast number crunching database for storing lots of juicy performance data.

An addition I like to read all the various best practice frameworks and methodologies and I write about them a fair bit. As a result of this interest, I have a SharePoint IT portal template that I have developed over the last couple of years, designed around the guiding principle of passive compliance. That is, by utilising the portal for IT various operational tasks, structured in a certain way, you implicitly address some COBiT/ISO27001 controls as well as leverage ITIL principles. I designed it in such a way that an auditor could take a look at it and it would demonstrate the assurance around IT controls for operational system support. It also had the added benefit of being a powerful addition to disaster recovery strategy. (In the second article, to be published soon, I will describe my IT portal in more detail).

Finally, I have SQL Reporting Services integrated with SharePoint, used to present enterprise data from various databases into the IT Portal – also as part of the principle of passive compliance via business intelligence.

Recently, I was called in to help conduct a demonstration of the aforementioned PI software, so I decided to add PI functionality to my existing "passive compliance" IT portal to integrate asset and control data (like change/configuration management) along with real-time performance data. All in all I was very pleased with the outcome as it was done in a day with pretty impressive effect. I was able to do this with minimal coding, utilising various features of all three of the above applications with a few other components and pretty much wrote no code at all.

Below I have built a conceptual diagram of the solution. Unfortunately I don’t have Visio installed, but I found a great freeware alternative 😉

Image0003

I know, there is a lot to take in here (click to enlarge), but if you look in the center of the diagram, you will see a mock up of a SharePoint display. All of the other components drawn around it combine to produce that display. I’ll now talk about the main combination, PI and SQL Reporting Services.

A slice of PI

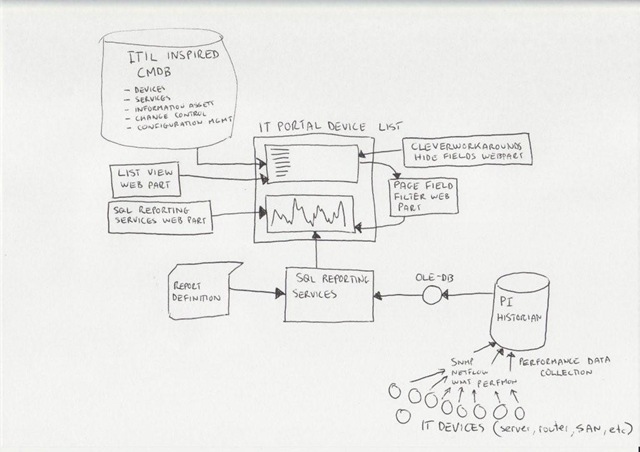
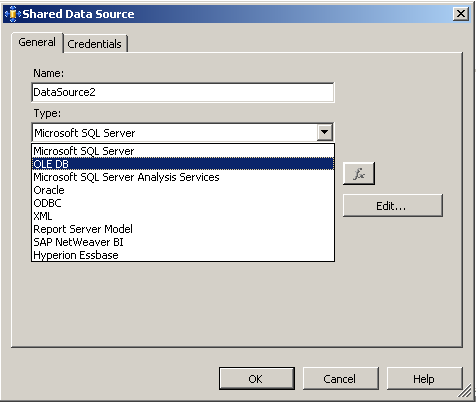
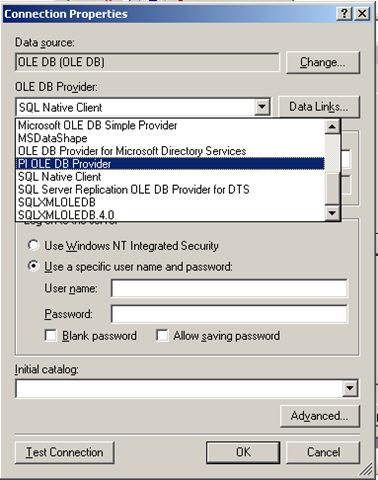
Okay so let’s explain PI because I think most people have a handle on SharePoint :-).

To the right is the terminator looking at data from a PI historian showing power flow in California. So this product is not a lightweight at all. It’s heritage lies in this sort of critical industrial monitoring.

Just to get the disclaimers out of the way, I do not work for OSISoft anymore nor are they even aware of this post. Just so hard-core geeks don’t flame me and call me a weenie, let me just say that I love RRDTool and SmokePing and prefer Zabbix over Nagios. Does that make me cool enough to make comment on this topic now? 🙂  

Like RRDTool, PI is a data historian, designed and optimised for time-series data.

"Data historian? Is that like a database of some kind?", you may ask. The answer is yes, but its not a relational database like SQL Server or Oracle. Instead, it is a "real-time, time series" data store. The English translation of that definition, is that PI is extremely efficient at storing time based performance data.

"So what, you can store that in SQL Server, mySQL or Oracle", I hear you say. Yes you most certainly can. But PI was designed from the ground up for this kind of data, whereas relational databases are not. As a result, PI is blisteringly fast and efficient. Pulling say, 3 months of data that was collected at 15 second intervals would literally take seconds to do, with no loss of fidelity, even going back months.

As an example, let’s say you needed to monitor CPU usage of a critical server. PI could collect this data periodically, save it into the historian for later view/review/reporting or analysis. Getting data into the historian can be performed a number of ways. OSISoft have written ‘interfaces’ to allow collection of data from sources such as SNMP, WMI, TCP-Response, Windows Performance Monitor counters, Netflow and many others.

The main point is that once the data is inside the historian, it really doesn’t matter whether the data was collected via SNMP, Performance Monitor, a custom script, etc. All historian data can now be viewed, compared, analysed and reported via a variety of tools in a consistent fashion.

SQL Reporting Services

For those of you not aware, Reporting Services has been part of SQL Server since SQL 2000 and allows for fairly easy generation of reports out of SQL databases. More recently, Microsoft updated SQL Server 2005 with tight integration with SharePoint. Now when creating a report server report, it is "published" to SharePoint in a similar manner to the publishing of InfoPath forms.

Creating reports is performed via two ways, but I am only going to discuss the Visual Studio method. Using Visual Studio, you are able to design a tailored report, consisting of tables and charts. An example of a SQL Reporting Services Report in visual studio is below. (from MSDN)


The interesting thing about SQL Reporting services is that it can pull data from data sources other than SQL Server databases. Data sources include Oracle, Web Services, ODBC and OLE-DB. Depending on your data source, reports can be parameterised (did I just make up a new word? 🙂 ). This is particularly important to SharePoint as you will soon see. It essentially means that you can feed your report values that customise the output of that report. In doing so, reports can be written and published once, yet be flexible in the sort of data that is returned.

Below is a basic example:

Here is a basic SQL statement that retrieves three fields from a data table called "picomp2". Those fields are "Tag", "Time" and "Value". This example selects values only where "Time" is between 12-1pm on July 28th and where "tag" contains the string "MYSERVER"

SELECT    "tag", "time", "value"
FROM      picomp2
WHERE     (tag LIKE '%MYSERVER%') AND ("time" >= '7/28/2008 12:00:00 PM') AND ("time" <= '7/28/2008 1:00:00 PM')

Now what if we wanted to make the value for TAG flexible? So instead of "MYSERVER", use the string "DISK" or "PROCESSOR". Fortunately for most data sources, SQL Reporting Services allows you to pass parameters into the SQL. Thus, consider this modified version of the above SQL statement.

SELECT    "tag", "time", "value"
FROM      picomp2
WHERE     (tag LIKE '%' + ? + '%') AND ("time" >= '7/28/2008 12:00:00 PM') AND ("time" <= '7/28/2008 1:00:00 PM') 

Look carefully at the WHERE clause in the above line. Instead of specifying %MYSERVER%, I have modified it to %?%. The question mark has special meaning. It means that you will be prompted to specify the string to be added to the SQL on the fly. Below I illustrate the sequence using three screenshots. The first screenshot shows the above SQL inside a visual studio report project. Clicking the exclamation mark will execute this SQL.

image

Immediately we get asked to fill out the parameter as shown below. (I have added the string "DISK")

image

Clicking OK, and the SQL will now be executed against the datasource, with the matching results returned as shown below. Note the all data returned contains the word "disk" in the name. (I have scrubbed identifiable information to protect the innocent).

image

Reporting Services and SharePoint Integration

Now we get to the important bit. As mentioned earlier, SharePoint and SQL Reporting Services are now tightly integrated. I am not going to explain this integration in detail, but what I am going to show you is how a parameterised query like the example above is handled in SharePoint.

In short, if you want to display a Reporting Services report in SharePoint, you use a web part called the "SQL Server Reporting Services Report Viewer"

image

After dropping this webpart onto a SharePoint page, you pick the report to display, and if it happens to be a parameterised report, you see a screen that looks something like the following.

image

Notice anything interesting? The webpart recognises that the report requires a parameter and asks for you to enter it. As you will see in the second article, this is very useful indeed! But first let’s get reporting services talking to the PI historian.

Fun with OLEDB

So, I have described (albeit extremely briefly) enough information about PI and Reporting services. I mentioned earlier that PI is not a relational database, but a time series database. This didn’t stop OSISoft from writing an OLEDB provider 🙂

Thus it is possible to get SQL reporting services to query PI using SQL syntax. In fact the SQL example that I showed in the previous section was actually querying the PI historian.

To get reporting services to be able to talk to PI, I need to create a report server Data Source as shown below. When selecting the data source type, I choose OLE DB from the list. The subsequent screen allows you to pick the specific OLEDB provider for PI from the list.

image image

Now I won’t go into the complete details of completing the configuration of the PI OLE DB provider, as my point here is to demonstrate the core principle of using OLE DB to allow SQL Reporting Services to query a non-relational data store.

Once the data source had been configured and tested (see the test button in the above screenshot), I was able to then create my SQL query and then design a report layout. Here is the sample SQL again.

SELECT    "tag", "time", "value"
FROM      picomp2
WHERE     (tag LIKE '%' + ? + '%') AND ("time" >= '7/28/2008 12:00:00 PM') AND ("time" <= '7/28/2008 1:00:00 PM') 

As I previously explained, this SQL statement contains a parameter, which is passed to the report when it is run, thereby providing the ability to generate a dynamic report.

Using Visual Studio I created a new report and added a chart from the toolbox. Once again the purpose of this post is not to teach how to create a report layout, but below is a screenshot to illustrate the report layout being designed. You will see that I have previewed my design and it has displayed a textbox (top left) allowing the parameter to be entered for the report to be run. The report has pulled the relevant data from the PI historian and rendered it in a nice chart that I created.

image

Conclusion

Right! I think that’s about enough for now. To sum up this first post, we talked a little about my IT portal and the principle of "passive compliance". We examined OSISoft’s PI software and how it can be used to monitor your enterprise infrastructure. We then took a dive into SQL Reporting services and I illustrated how we can access PI historian data via OLE DB.

In the second and final post, I will introduce my IT Portal template in a brief overview, and will then demonstrate how I was able to integrate PI data into my IT portal to combine IT asset data with real-time performance metrics with no code 🙂

I hope that you found this post useful. Look out for the second half soon where this will all come together nicely

cheers

Paul


« Previous PageNext Page »

Today is: Wednesday 3 June 2026 -