Back to Cleverworkarounds mainpage
 

Demystifying SharePoint Performance Management Part 5 – So what is latency anyway?

Hi all

Welcome to part 5 in my attempt to make SharePoint performance management a little more accessible. Now that we have dealt with the world of request per second in parts two, three and four, we will focus our attention somewhere different for a post or three.

To set the scene, we are going to take a bit of an end to end look at what it takes to load a SharePoint page. I suspect some readers do not have the full picture on just how many components interact together just to load the SharePoint home page. Things are much more complex in reality than the typical architectural view that adorns SharePoint blogs. A typical SharePoint diagram will list the servers and their roles, but what about all…

  • the network gear like routers, switches, reverse proxies and firewalls that are part of the mix?
  • the VMWare or HyperV virtual hosts that provide the virtualised servers? And
  • the storage area network and its associated paraphernalia that these virtual servers make use of for disk infrastructure?

Make no mistake people, configurations these days are hugely complex and have many moving parts. If any of the various components listed above were to fail or become a bottleneck, the performance of the entire system suffers. Therefore, we need assurance that each component has been optimised to ensure overall function.

This brings us onto the topic of latency. If you are not sure what latency is, I can guarantee that you actually do know. You see, if you have ever experienced a jittery skype call, or your pornography is slow to load, or you have watched a roving reporter respond several seconds after being asked a question from the studio, you are experiencing latency.

Now, the important point to make straight up is that latency is unavoidable because of the laws of physics. Take the example of one of the rovers that NASA sent to Mars. All radio signals to Mars travel at the speed of light (which despite Star Trek’s best efforts to persuade us otherwise, is the absolute speed limit of the universe). The speed of light is around 300,000 kilometres per second and the distance to Mars is currently around 150 million kilometres from Earth. So doing some basic math, we find that it takes a little over 8 minutes for a signal to get from Earth to Mars.

  • 150,000,000 / 300,000 = 500 seconds
  • 500 / 60 = 8.3 minutes

In this example of latency, no matter what  happens, there will always be around 8 minutes of latency between the time an instruction is sent to a rover, to the time it receives and acts on it. Unless Einstein was wrong, this isn’t about to change in a hurry either.

A “lean” view of latency…

Latency is a concept that extends beyond the forces of nature. Let me give you another form of latency that I am sure you have experienced, using Microsoft as the straw man. Let’s say you have a problem with SharePoint and you log a call with Microsoft or your support provider. You call the technical support line and after twiddling your thumbs in the telephone queue for an eternity, you get an inexperienced level 1 tech, who doesn’t understand your problem at all and is hell bent on closing your call anyway because someone higher up in the organisation actually believed that call-time is an indicator of happy customers. You repeat yourself each and every time as your call is slowly routed up the tech support hierarchy. Finally, by the time you get to level 3 or 4, you finally get a good tech who gives you the quick answer you were looking for. The problem is that three weeks have passed to get to this point.

This is also a form of latency. But unlike the first example. It was not the laws of nature this time, but man made laws that caused wasted time. I will call it organisational latency. Addressing this form of latency is a multi billion dollar industry, and keeps an army of organisational/process improvement consultants busy, trying to reduce wastage and improve customer outcomes (now you know what Lean is all about if you hear people taking about it).

So, returning to the SharePoint context – we have a lot of moving parts. We know we cannot alter the laws of physics, but how do we know whether all of the various components are working to their optimum level? Is there any man-made latency that we could reduce or eliminate?

Oh, yes, indeedie there is… and to put some context  to it, let’s utilise the musical genius that is the Wiggles. I found that their rendition of the old folk song “Dem bones” serves my purpose nicely.


The Wiggles, teaching us about SharePoint latency 🙂

When you perform the seemingly benign task of requesting a page with your browser, an amazing number of things have to happen. The browser forms a HTTP request and then passes this to the TCPIP stack on your PC, which takes the HTTP request and breaks it up into IP packets. These packets are passed to your network card driver that turns these packets into Ethernet frames and sends them over the wire. Each network device (switch, router, etc.) has to process each frame or IP packet and to work out where to forward it. Eventually the request finds it way to the destination server where the Ethernet frames are stripped, the IP packets are reassembled into the original HTTP request, passed to IIS and SharePoint then acts on it.

Now all I described above was the task of getting a HTTP request from a browser to a server. To see the entire picture, let’s all sing along with the Wiggles shall we? We will assume a two server deployment, utilising a VMware based virtual web front end SharePoint server and a physical SQL Server. Both servers use a Storage Area Network (SAN) for disk. Cue the melody from “Dem Bones”…

  • Your PC connects to a distribution switch
  • The distribution switch is connected to the core switch
  • The core switch connects to the HyperV host
  • The HyperV host connects to the virtual Web Front End Virtual Machine

… okay so we have managed to get from our browser to the SharePoint web front end but at this point, the web front end hasn’t really done anything yet.  In terms of latency, we had to get through the switches, as well as the virtualisation infrastructure to the virtual SharePoint web front end box. The switches had very little latency at all – probably around 1-2 microseconds (which translates about 0.001 to 0.002 milliseconds) for a network packet to go in one port and out the other. The virtualisation infrastructure also introduced some latency, because there is overhead in running a virtual machine within a physical machine. However, assuming it is well configured and that there aren’t too many virtual machines competing for physical resources like CPU and memory, then that latency is fairly negligible.

Now the virtual web front end server needs to actually deal with the request from your PC. This involves pulling data from the disk infrastructure, so back to the Wiggles we go…

  • the Web Front End Virtual Machine connects to the HyperV host
  • The HyperV host connects to the SAN Switch
  • The SAN Switch connects to the Storage Array
  • The Storage Array connects to the Web Front End disk
  • The Web Front End disk returns data to the SAN Switch
  • The SAN switch returns data to the HyperV host
  • The HyperV host returns data to the Web Front End Virtual Machine

…at this point, the web front end server has retrieved any data it needs to from the disk subsystem. There was definitely latency here. The SAN switches have a similar latency to network switches which is negligible, but the physical disks on the SAN are another story (which we will get to soon). But wait a second – that just loads the stuff the web front end server stores or caches locally, as well as writing to the IIS and SharePoint logs. What about all those sexy web parts you have on the front page that aggregate the latest news feed? That stuff needs to pull information from the SharePoint content database on the SQL Server. So let’s continue, now incorporating the connection between the virtual web front end and SQL Server (Remember, I am assuming the SQL box is not virtualised).

  • The Web Front End Virtual Machine connects to SQL box (via the network on TCPIP port 1433)
  • The SQL Box connects to the SAN Switch
  • The San Switch connects to the Storage Array
  • The Storage Array connects to the SQL disk
  • The SQL disk returns data to the SAN Switch
  • The SAN switch connects to the SQL box
  • The SQL Box connects to Web Front End Virtual Machine (via the network on TCP port 1433)
  • The Web Front End Server returns the page to your PC (via the network on TCP port 80)

Now at this point, non tech oriented readers might be thinking, “Bloody hell! I didn’t realise there were that many interactions.” For you guys… now you know why tech guys are the way they are. Tech guys reading this would know full well that I glossed over many things. For example, I did not include the authentication process in the sequence above, nor did I describe important virtualisation aspects such as VM memory compression. On top of that I glossed big-time over the full gamut of SAN I/O paths.

There is a form of man-made latency that can occur in any of these steps outlined above as a result of the complexity. It is very easy to overlook an important aspect, or to misconfigure something or to assume the default configuration is optimal. In my consulting experience I have seen sub optimal configuration in all of the above touchpoints, but out of all of them, there is one area that is far more likely to have latency issues than any of the other areas: The disk infrastructure.

We will round out this post by taking a fairly high level view at disk infrastructure and why it is latency prone.

Understanding disk latency

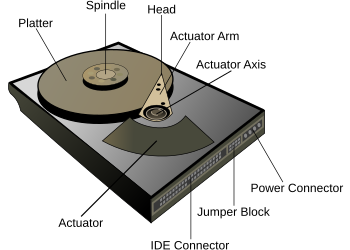
Below is a Wikipedia picture that shows the essential components of most hard drives. This type of hard drive is really not that different from its original design in 1954. It is called a rotational hard drive and the spindle rotates, while the actuator arm moves the head to the right position to read data off the platter. As you can imagine, this happens pretty fast too. Most high end hard drives spin the platter at 15000RPM – dizzying, eh?


But to put disk performance in perspective, consider my previous example of a network switch with a 1-2 microsecond latency to process an Ethernet frame as it transits through one network port to another. By comparison, a modern hard drive takes a hell of a lot longer to do what it needs to do. As a simple example, the time taken just for the drive to rotate the disk platter takes around 2 milliseconds (or 2000 microseconds). Not only is this a staggering 2000 times slower than the network switch but it does not take into account the time it takes for the hard drive’s read/write head to then be positioned over the sector (this is called seek time and can take anywhere between 3 and 15 milliseconds).

This latency clearly is problematic, and vendors compensate by utilising multiple sets of disks and liberal use of cache technology to mitigate it. Imagine putting 10 hard disks together and when data is saved, parts of it is written to each hard disk. Now you have reduced latency because each drive is handling a smaller part instead of a single drive handling it all. It is important to note that we have done nothing about laws of physics latency per single drive (thanks Robert Bogue for pointing that out) , but throughput induced latency has reduced by using them all. It is just like when you are out the supermarket and there are ten check-out operators working instead of 1. The wait times are much shorter because there are more check out operators available to service the request. (This is the essence of RAID technology and should be familiar to most readers).

But there is still more to the latency story than disks taking time to do their thing. At the operating system level, there are various layers and drivers doing stuff. I won’t go too much into this is except to suggest that if the world of the Class Drivers, Port Drivers, Device Miniport Drivers and Disk Subsystems rock your world then Jeff Hughes has a great writeup where he describes the whole Windows disk IO system in detail.

A note on SSD

I would be remiss not to make a point about these newfangled Solid State Drives (You might have heard them mentioned as SSD). This is a newer technology for hard drives that do not employ any moving mechanical components, like platters and movable read/write heads. Solid State Drives have some seriously improved performance in terms of latency, because they store the data in persistent memory. Wikipedia cites that SSD latency is around 0.1 millisecond compared to rotational drives being around 5-10 milliseconds. The downside is that they are more expensive than traditional rotational disks. According to a May 2012 article, SSDs cost approximately US$0.65 per GB whereas traditional hard disks cost about US$0.05 per GB. Expect prices to continue to fall and for them to appear in more and more solutions.

Then there are SANs

In terms of disk infrastructure and latency aspects, most organisation’s utilise a Storage Area Network (SAN) topology. I previously mentioned the idea of RAID configurations that make use of multiple disks to improve latency (among other things). SANs take the RAID idea and abstracts it further as shown below.

image

(credit for this image is Orbis solutions: http://orbissolutionsinc.com/blog/tag/storage-arrays/)

I sometimes describe SANs to people as a “fridge full of hard drives connected to multiple servers”. What the above diagram shows is that the disks are physically not connected to the servers that use them. Instead they are connected to a storage array via cables, with a switch or three in between. Each server has some disk space reserved for it on the SAN. So the result is we have one centralised high performing disk array where we can take advantage of all of the disks housed within.

But it’s important to understand here that each time data is read from or written to disk, it passes across those cables and through the switches. Like an internet connection, the SAN switch and cables not only have bandwidth limitations, but are prone to misconfiguration. Imagine 50 servers writing data at the same time. If things are not well configured, the SAN switch infrastructure might become overwhelmed like a freeway during peak hour. Direct attached storage (i.e. – the hard drive or RAID array is plugged into the server directly) typically have a higher bandwidth. This quote from a nice sqlteam.com article on SAN performance explains it well.

For instance, if a server is equipped with two older 1-Gbps host bus adapters (HBAs), its MBps throughput would be capped at about 200MB per second no matter how powerful the rest of the SAN is. Replacing the 1-Gbps HBAs with two newer 4-Gbps HBAs or adding more HBAs may improve the throughput, if the HBAs are indeed the throughput bottleneck. But the SAN drive throughput could also be limited by the maximum throughput of the inter-switch links in the SAN switched fabric. Further down the I/O paths, the front-side adapter ports on the disk array, the cache in the disk array, the disk controllers, and the disk spindles can all become the bottleneck limiting the MBps throughput of the SAN drive.

Conclusion and coming next…

Okay… at this point let’s take a breather. For the tech guys reading this post, none of what I covered may seem particularly earth shattering, but it was important to set the context for a deeper dive into disk latency in the next couple of posts. If you are not normally of the tech persuasion, then I hope that this post has opened your eyes a little to just how complicated deployments can be and accordingly, how hard it can sometimes be to pinpoint latency issues when they occur.

In the next post, we will take a deeper look at disk latency and its relationship to the indicators of IOPS and MBPS. We will then examine tools to measure latency and how to best use it as a lead indicator.

Until then, thanks for reading and be sure to check out my recent business book “The Heretics Guide to Best Practices

Paul Culmsee

www.sevensigma.com.au


Demystifying SharePoint Performance Management Part 4 – Making use of RPS

Hi all. Welcome to part 4 of a rapidly growing series of posts on trying to take some of the mystery out of SharePoint performance management. Essentially I am trying to write a sort of preamble to the existing Microsoft resources which are extremely comprehensive and full of wisdom, but suffer from being rather large and a lot to get through. To remind you, we have the 307 page “Planning guide for server farms and environments for Microsoft SharePoint Server 2010,” the 367 page “Capacity Planning for Microsoft SharePoint Server 2010” and the lesser known, but equally excellent 23 pages of “Analysing Microsoft SharePoint Products and Technologies Usage” whitepaper.

My hope that this series establishes just enough groundwork for someone to find the aforementioned documents an easier read and get more out of them.

Now this series is starting to turn out like the “Humble Tribute to the Leave Form” series, which I never actually finished (*blush*). Basically the number of posts to complete it exceeded the time I had available to write it (and my interest shifted to other things). For this topic of performance, I originally thought this series might be 4 posts but we are now at post 4 and haven’t actually gotten off the Requests Per Second (RPS) performance counter yet.

So let’s cracking…

Command line alert (again)

I have a tendency to have fun at the expense of IT stereotypes in my posts, and in the interests of fairness, I turned this around in part 3 I and took the piss out of the “I’m business, not technical” wusses instead. You all know who you are… you tend to shun anything that involves the command line as if it was the most complex thing ever. So continuing in that vein, if I managed not to completely scare the crap out of you in the last post, you should have the excellent log parser utility installed and have created a file called LogWithSeconds.csv.  If you have not, go back and read part 3. To remind you quickly, the log parser command that we used to generate the LogWithSeconds.csv file was:

logparser -i:IISW3C file:GetSeconds.txt?startdate=’2011-11-15′+enddate=’2011-11-15′ -o:csv >LogWithSeconds.csv

The key point being that you can specify a date range for the logs you want to process.

For the rest of this article, we continue to play in the command-line playground and utilise some different logparser scripts to derive some useful information. In addition, we will utilise a bit of PowerShell, as well as check out another great free utility written by Nikander & Margriet Bruggeman (more on that later).

Also at this point I need to call out and credit the excellent work of Mike Wise. His aforementioned 2009 whitepaper called“Analysing Microsoft SharePoint Products and Technologies Usage” is the basis for what I cover here. I urge you to download and read this article as it goes into more detail on Log Parser and its uses beyond just RPS alone. Although I have based my stuff off Mike’s work, there are some differences that you will see as we progress through this article.

Distribution of RPS

The one thing that past examination of RPS can give you is a distribution of requests over time. Understanding the distribution (or shape of RPS) helps you to identify patterns to SharePoint use, such as peak or heavy usage times. To that end, the first log parser script will generate a CSV file that can be imported into a tool like excel to chart the distribution of RPS. The log parser script below has been modified from one in Mike’s document, because he assumes you are only looking at 24 hours of log data. In my case, I assume that you might want to profile more than 24 hours (essentially the date range specified in the log parser command above).

The command to generate a per-second RPS distribution is below. The only difference between my script and the one Mike did is I added the “date” field to the SQL to account for multiple days:

logparser -i:CSV -o:CSV “select count(*) as ct,date as Date, secs,max(hh) as hh,max(mi) as mi,max(ss) as ss from e:\temp\LogWithSeconds.csv group by date,secs order by date, secs” -q >RPSDistribution.csv

This command will create a new CSV file called RPSDistribution.CSV that contains the count of requests at any given second during the specified date range. So let’s open RPSDistribution.CSV into Excel and create a chart (I assume you know how to do that). Here is what it looks like…

image

Now I wonder if you can spot the issue with this chart? If you look closely, note that the times are not evenly spaced. This occurs because the generated file (RPSDistribution.CSV) only contains entries for the seconds during the day where there were requests. If no requests were made, then nothing was recorded. This skews the graph because if we want to see the distribution of requests, we also need to know the seconds of the day where there were zero requests. The graph you see above has effectively squeezed out all of the quiet times.

To work around this issue, I wrote the following PowerShell script. For you non-programmers, I am not going to explain all of the gory logic of this script, but just be assured that it adds entries stating zero RPS for every second of the day where there were no requests made. This will normalise the data across time and make a much more meaningful graph.

(If this is starting to hurt your brain, stick with me… paste the code below into notepad, save it in the Log parser installation folder and call it AddNulsPerSec.ps1)

param([string]$inputcsv, [string]$outputcsv = "output.csv")
if (!$inputcsv) {
    write-host "The -inputcsv parameter has not been specified. Script cannot run without it";
    exit;
}
if (Test-Path -path $outputcsv) { remove-item $outputcsv }
$x = 0;
$y = import-csv $inputcsv
write-output "ct,date,secs,minu,hh,mm,ss" | add-content -path $outputcsv
$y | foreach {
    if ($x -gt 86399) { $x = 0 }
    $s = [int]$_.secs;
    while ($s -gt $x) {
        $d = [datetime]$_.date;
        $d=$d.AddSeconds($x)
        $ss = $d.tostring("ss")
        $mm = $d.tostring("mm")
        $hh = $d.tostring("HH")
        $minu = [int]$hh * 60 + [int]$mm
        $output = "0" + "," + $_.Date + "," + $x + "," + $minu + "," + $ss + "," + $mm + "," + $hh
        write-output $output
        $x++;
   }
   $output = $_.ct + "," + $_.Date + "," + $_.secs + "," + $_.minu + "," + $_.ss + "," + $_.mi + "," + $_.hh
   write-output $output
   $x++;
} | add-content -path $outputcsv

The above script takes two command-line parameters: inputCSV and outputCSV. inputCSV is the file name to process and outputCSV is the resulting file with the 0 RPS entries added. Note that to run this script you will need to use a PowerShell window, rather than a command prompt. Below is the command I used:

PS C:\Program Files (x86)\Log Parser 2.2> .\AddNulsPerSec.ps1 -inputcsv RPSDistribution.CSV -outputcsv RPSDistributionNormalised.CSV

This created the file RPSDistributionNormalised.CSV. I charted this file in Excel and we now have a time-normalised distribution. Take a look at the X axis. This looks more logical now as the times are more evenly spaced. It seems from looking at this, that peak times are between 10am-11am, although one could argue that a lot of the day was fairly busy, with a bit of a lull between 2 and 3pm.

image

So what else can we do?

Right, so apart from the utility of being able to get a sense of when there are a lot of requests versus quiet times, can we find out anything else useful? Much insight can be gleaned from Mike Wise’s document, so here I will cover a couple of things specific to RPS.

RPS distribution for certain users

Let’s go back to the LogWithSeconds.CSV we started with and find out the top users for the period being examined. In the log parser command below we are grouping users by total requests they made, ordering from largest to smallest..

logparser -i:csv “select top 20 count(*) as ct,cs-username as user from LogWithSeconds.csv group by user order by ct desc”

A snippett of the output from this command is below:

ct  user
--- --------------------
840 DOMAIN\Jame.Smith
688 DOMAIN\searchcrawler
614 DOMAIN\Ian.Jones
508 DOMAIN\Steve.Hill
357 DOMAIN\Ant.Cough
313 DOMAIN\dom.davies
260 DOMAIN\matthew.martin

Hmm, I notice that the search crawler account (DOMAIN\searchcrawler) was busy during that day. It appears to have made the second largest number of requests. How about we work out when the search crawler was active by filtering the requests just for this user. Perhaps search crawls are active during peak times and introducing unnecessary load on the server?

First up, lets create the RPS distribution, but this time just for the search crawler account (note the SQL WHERE clause in the command below)

logparser -i:CSV -o:CSV “select count(*) as ct,date as Date, secs,max(hh) as hh,max(mi) as mi,max(ss) as ss,cs-username as user from LogWithSeconds.csv where user=’DOMAIN\searchcrawler’  group by user, date,secs order by date, secs” -q>crawler.csv

Now we need to pad CRAWLER.CSV out with 0 entries to time-normalise it for the seconds in which it wasn’t active…  back to my PowerShell script…

PS C:\Program Files (x86)\Log Parser 2.2> .\AddNulsPerSec.ps1 -inputcsv crawler.csv -outputcsv CrawlerNormalised.csv

I then took the results from CrawlerNormalised.csv and added them to my previous RPS distribution chart in Excel. Straight away you can see the incremental crawl schedule of this SharePoint installation is 5 hourly. (Note the red lines at regular intervals)

image

RPS Distribution for certain clients…

Another use for RPS is to see the pattern of the various applications that interact with SharePoint. Aside from the trusty old browser, we also have Office clients, Windows Explorer, SharePoint Workspace, and 3rd party tools like SharePlus. All of these applications identify themselves to SharePoint via the use of something called the user-agent [stored in the LogWithSeconds.CSV file in a column called cs(user-agent)]. The user agent field is actually part of the HTTP standard and not SharePoint specific, but let’s take advantage of it…

logparser -i:CSV “select count(*) as ct,cs(user-agent) from LogWithSeconds.CSV group by cs(user-agent) order by ct desc” -q >BrowserList.csv

Now, I am not going to paste the complete output of running this command because unfortunately, browsers have a lot of variation in their user agent string. Nevertheless, here are some of results from the BrowserList.csv file…

867 Mozilla/4.0+(compatible;+MSIE+7.0;+Windows+NT+5.1;+Trident/4.0;+.NET+CLR+1.1.4322;+.NET+CLR+2.0.50727;+.NET+CLR+3.0.04506.30;+.NET+CLR+3.0.04506.648;+.NET+CLR+3.0.4506.2152;+.NET+CLR+3.5.30729;+yie8)
688 Mozilla/4.0+(compatible;+MSIE+4.01;+Windows+NT;+MS+Search+6.0+Robot)
386 harmon.ie+for+Notes
333 Mozilla/5.0+(Windows;+U;+Windows+NT+6.1;+en-US;+rv:1.9.2.24)+Gecko/20111103+Firefox/3.6.24
250 SharePlus+2.9.5+(iPad;+iPhone+OS+4.2.1;+en_AU)
99  MSFrontPage/12.0
95  Mainsoft+SharePoint+Integrator
68  Microsoft+Office/14.0+(Windows+NT+6.1;+OWSSUPP+14.0.6112;+Pro)
34  Microsoft-WebDAV-MiniRedir/6.1.7600
24  Microsoft+Office+Outlook+2010+(14.0.6112)+Windows+NT+6.1
23  Microsoft+Office+Sharepoint+Workspace+2010+(14.0.6112)+Windows+NT+6.1
4   MobileSafari/7534.48.3+CFNetwork/548.0.3+Darwin/11.0.0

Now looking at these strings, it doesn’t take long to get a sense of the different ways SharePoint has been accessed. How about we generate a distribution of RPS for all iPad devices or apps? Here’s the log parser command along with my time normaliser script.

logparser -i:CSV -o:CSV “select count(*) as ct,date as Date, secs,max(hh) as hh,max(mi) as mi,max(ss) as ss,cs(User-Agent) as ua from LogWithSeconds.CSV where ua like ‘%iPad%’ group by ua, date,secs order by date, secs”-q >iPads.csv

.\AddNulsPerSec.ps1 -inputcsv E:\temp\ipads.csv -outputcsv e:\temp\iPadNormalised.csv

… and the result when added into Excel? iPads were definitely the evening tool of choice that day! Note the green spikes around 9-10pm.

image

Taking it further…

I won’t do much more on RPS now. Hopefully I have given you enough to do much more clever things than I have covered. As I stated in part 2, the nice thing about RPS is that it can be derived from web server logs and these tend to go back quite far in time. Given that the core sequence of events to produce the graphs above are essentially 3 scripts and can be done quickly, it becomes quite easy to sample different points in history. For example: Let’s say that we want to compare the 15th of November 2011 with the 10th of March 2012 to see whether there is an increase/decrease in requests and what this looks like. All we have to do is change the date, re-run the scripts and do some charting magic.

  • logparser -i:IISW3C file:GetSeconds.txt?startdate=’2012-3-10′+enddate=’2012-3-10′ -o:csv >LogWithSeconds.csv
  • logparser -i:CSV -o:CSV “select count(*) as ct,date as Date, secs,max(hh) as hh,max(mi) as mi,max(ss) as ss from LogWithSeconds.csv group by date,secs order by date, secs” -q >RPSDistribution.csv
  • AddNulsPerSec.ps1 -inputcsv RPSDistribution.CSV -outputcsv RPSDistributionNormalised.CSV

We can look at the distribution for an entire week is we wanted to…

  • logparser -i:IISW3C file:GetSeconds.txt?startdate=’2012-5-7′+enddate=’2011-5-11′ -o:csv >LogWithSeconds.csv
  • logparser -i:CSV -o:CSV “select count(*) as ct,date as Date, secs,max(hh) as hh,max(mi) as mi,max(ss) as ss from LogWithSeconds.csv group by date,secs order by date, secs” -q >RPSDistribution.csv
  • AddNulsPerSec.ps1 -inputcsv RPSDistribution.CSV -outputcsv RPSDistributionNormalised.CSV

Also in case you didn’t notice in part 3, my GetSeconds.txt logparser script that performs the initial processing of the IIS logfiles, also stores the minute of the day, as well as seconds of the day. This allows you to perform all of the same things I have specified in this article except it can be Requests Per Minute (RPM) instead. This would allow you to work with a larger date range without such big files (provided RPM is appropriate for what you want). Consult the “Analysing Microsoft SharePoint Products and Technologies Usage” whitepaper for more information on logparser queries for RPM scenarios.

Remember that the virtues of your web server logs go much further than RPS. We saw a hint of this in my examples of showing RPS for just one user or one device type. But this really is just scratching the surface of what can be gleaned via logparser. There are many excellent logparser scripts around, and a quick google search should give you plenty of examples.

Also remember that there are many more sophisticated ways to process this sort of data. For example, putting it into Analysis Services and slicing/dicing it via PowerPivot, or using something like RRDTool. To that end, I would also be seriously remiss if I did not make you aware of the SharePoint Flavored Weblog Reader tool. It was created by Nikander & Margriet Bruggeman who run the SharePoint Dragons blog – probably the best SharePoint performance related blog out there. This tool was specifically designed to make it easier to analyse IIS logs for SharePoint specific information. It is a command line tool, but much simpler and slicker than the methods I introduced in this post. Instead of specifying a date range you specify the number of items from the logs to process. For example:

sfwr.exe 250,000 “E:\LOGS\IIS_WWW\W3SVC1045333159”

Here are some of the things it reports on for you straight out of the box:

  • Most busy days of the week, most requested pages and requested pages per day.
  • The average, max and min request times per URI, InfoPath URI and Report Server URI.
  • Browser percentages, dead links, failed pages, percentage of error page requests.
  • Requests per hour per day, requests per hour, requests per user (also per week and month)
  • Slowest requests, top requests per hour, top visitors.
  • Traffic per day and per week in MB.
  • Unique visitors per day, week and month

Reflections…

At the end of the day, while examining the pattern of RPS can be very handy in offering insights into how your web application (SharePoint or otherwise) performs, as a lead indicator it is always going to be fairly wishy washy. As soon as you turn your attention to the future, many variables come into play that you cannot predict as accurately as you’d like. Your existing webserver logs can offer you a lot of ways to help make a more informed prediction, but at the end of the day, one has to take into account the new unique features of SharePoint 2010, how they will be used and so forth.

I will be returning to this theme, once we examine some other performance indicators, but hopefully at this point, you might find some aspects of Microsoft’s Capacity planning for Microsoft SharePoint Server 2010 guide less intimidating. Page 43 in particular has some great material that builds upon what we cover here. To quote Microsoft…

Understanding the distribution of the requests based on the clients applications that are interacting with the farm can help predict the expected trend and load changes after migrating to SharePoint Server 2010. As users transition to more recent client versions such as Office 2010, and start using the new capabilities new load patterns, RPS and total requests are expected to grow

I will leave you with a terrific example a graph that Microsoft created using IIS logs (on page 44 of the aforementioned document). This is a view of a typical day in an internal Microsoft environment serving what is deemed “a typical social solution”. It shows just how much additional load a new feature can introduce (in this case, Outlook Social Connector feature is 6.2% of the total number requests). The combination of different clients on the X axis, with the % distribution of overall and per-user requests on the Y axis is really handy.

image

Coming up next…

At this point I think we have covered RPS sufficiently, and dovetailed in nicely to Microsoft documentation – particularly pages 41-47 of the SharePoint 2010 Capacity Planning Guide. Our next stop will be looking at another much misunderstood lead indicator for performance – disk IO and latency. Once again I will introduce you to a couple of useful tools and offer you what I think is the best way to approach disk performance requirements that will make life easier for you and your storage people.

Until then, thanks for reading…

Paul Culmsee

HGBP_Cover-236x300


Demystifying SharePoint Performance Management Part 3 – Getting at RPS

Hi and welcome back to this series aimed at making SharePoint performance management a little more digestible. In the first post we examined the difference between lead and lag indicators and in the second post, we specifically looked at the lead indicator of Requests Per Seconds (RPS) and its various opportunities and issues. In this episode we are actually going to do some real work at the – wait for it – the command line! As a result the collective heart rates of my business oriented readers – who are avid users of the “I’m business, not technical” cliché  – will start to rise since anything that involves a command line is shrouded in mystique, fear, uncertainty and doubt.

For the tech types reading this article, please excuse the verboseness of what I go through here. I need to keep the business types from freaking out.

Okay… so in the last post I said that despite its issues in terms of being a reliable indicator of future performance needs, RPS has the advantage that it can be derived from your existing deployment. This is because the information needed is captured in web server (IIS) logs over time. Having this past performance means you have a lag indicator view of RPS, which can be used as a basis to understand what the future might look like with more confidence than some arbitrary “must handle x RPS.”

Now just because RPS is held inside web server log files, does not mean it is easy to get to. In this post, I will outline the 3 steps needed to manipulate logfiles to extract that precious RPS goodness. The utility that we are going to use to do this is Log parser.

Now a warning here: This post assumes your existing deployment runs on Microsoft’s IIS platform v7 (the webserver platform that underpins SharePoint 2010). If you are running one of the myriad of portal/intranet platforms, you are going to have to take this post as a guide and adjust to your circumstances.

Step 1: Getting Log parser

Installing Log parser is easy. Just install version 2.2 as you would any other tool. It will run on pretty much any Windows operating system. Once installed, it will likely reside in the C:\Program Files (x86)\Log Parser 2.2 folder. (Or C:\Program Files\Log Parser 2.2 if you have an older, 32 bit PC).

There you go business types – that wasn’t so hard was it?

Step 2: Getting your web server logs

After the relative ease of getting log parser installed, we now need the logs themselves to play with. We are certainly not going to mess with a production system so we will need to copy the log files for your current portal to the PC where you installed Log parser. If you do not have access to these log files, call your friendly neighbourhood systems administrator to get them for you. If you have access (or do not have a friendly neighbourhood systems administrator), then you will need to locate the files you need. Here’s how:

Assuming you have access to your web front end server/s, you can load Internet Information Services (IIS) Manager from Start->All programs->Administrative tools on the server. Using this tool we can find out the location of the IIS log files as well as the specific logs we need. By default IIS logs are stored in C:\inetpub\logs\LogFiles, but it is common for this location to be changed to somewhere else. To confirm this in IIS manager, click on the server name in the left pane, then click on the Logging” icon in the right pane. In the example below, we can see that the IIS logfiles live in G:\LOGS\IIS folder (I always move the logfiles off C:\ as a matter of principle). While you are there, pay special attention to the fairly nondescript “Use local time for file naming and rollover” tickbox. We are going to return to that later…

image  image

Okay so we know where the log files live, so lets work out the sub-folder for the specific site. Back in the left hand pane now, expand “Sites” and find the web site you want to profile for RPS. When you have found it, select it and find the “Advanced Settings” link and click it.

image_thumb5

On the next screen you will see ID of the site. It will be a large number – something like 1045333159. Take a note of this ID, because all IIS logs for this site will be stored in a folder with the name “W3SVC” prepended to this ID (eg W3SVC1045333159). Thus the folder we are looking for is G:\LOGS\IIS\W3SVC1045333159. Copy the contents of this folder to the computer where you have installed logparser to. (In my example below I copied the logs to E:\LOGS\IIS_WWW\W3SVC1045333159 on a test server).

image10_thumb2 image14_thumb

Step 3: Preparation of log files…

Okay, so now we have our log files copied to our PC, so we can start doing some log parser magic. Unfortunately default IIS logfile format does not make RPS reporting particularly easy and we have to process the raw logs to make a file that is easier to use. Now business people – stay with me here… the payoff is worth the command line pain you are about to endure! Smile

First up, we will make use of the excellent work of Mike Wise (You can find his original document here), who created a script for log parser that processes all of the logfiles and creates a single (potentially very large) file that:

  • includes a new field which is the time of the day converted into seconds
  • splits the date and timestamp up into individual bits (day, month, hour, minute, etc.) This makes it easier to do consolidated reports
  • excludes 401 authentication requests (way back in part 1 I noted that Microsoft excludes authentication traffic from RPS)

I have pasted a modified version of Mike’s log parser script below, but before you go and copy it into Notepad, make sure you check two really important things.

  1. Be sure to change the path in the second last line of the script to the folder where you copied the IIS logs to (In my case it was E:\LOGS\IIS_WWW\W3SVC1045333159\*.log)
  2. Check whether IIS is saving your logfiles using UTC timestamps or local timestamps. (Now you know why I told you to specifically make note of the “Use local time for file naming and rollover” tickbox earlier). If the box is unticked, the logs are in UTC time and you should use the first script pasted below. If it is ticked, the logs are in local time the second script should be used.

UTC Script

select EXTRACT_FILENAME(LogFilename),LogRow, date, time, cs-method, cs-uri-stem, cs-username,
c-ip, cs(User-Agent), cs-host, sc-status, sc-substatus, sc-bytes, cs-bytes, time-taken,

add(
    add(
         mul(3600,to_int(to_string(to_localtime(to_timestamp(date,time)),'hh'))),
         mul(60,to_int(to_string(to_localtime(to_timestamp(date,time)),'mm')))
    ),
    to_int(to_string(to_localtime(to_timestamp(date,time)),'ss'))
) as secs,

add(
    mul(60,to_int(to_string(to_localtime(to_timestamp(date,time)),'hh'))),
    to_int(to_string(to_localtime(to_timestamp(date,time)),'mm'))
) as minu,

to_int(to_string(to_localtime(to_timestamp(date,time)),'yy')) as yy,
to_int(to_string(to_localtime(to_timestamp(date,time)),'MM')) as mo,
to_int(to_string(to_localtime(to_timestamp(date,time)),'dd')) as dd,
to_int(to_string(to_localtime(to_timestamp(date,time)),'hh')) as hh,
to_int(to_string(to_localtime(to_timestamp(date,time)),'mm')) as mi,
to_int(to_string(to_localtime(to_timestamp(date,time)),'ss')) as ss,
to_lowercase(EXTRACT_PATH(cs-uri-stem)) as fpath,
to_lowercase(EXTRACT_FILENAME(cs-uri-stem)) as fname,
to_lowercase(EXTRACT_EXTENSION(cs-uri-stem)) as fext

from e:\logs\iis_www\W3SVC1045333159\*.log

where sc-status<>401 and date BETWEEN TO_TIMESTAMP(%startdate%, 'yyyy-MM-dd') and TO_TIMESTAMP(%enddate%, 'yyyy-MM-dd')

Local Time Script

select EXTRACT_FILENAME(LogFilename),LogRow, date, time, cs-method, cs-uri-stem, cs-username,
c-ip, cs(User-Agent), cs-host, sc-status, sc-substatus, sc-bytes, cs-bytes, time-taken,

add(
   add(
      mul(3600,to_int(to_string(to_timestamp(date,time),'hh'))),
      mul(60,to_int(to_string(to_timestamp(date,time),'mm')))
   ),
   to_int(to_string(to_timestamp(date,time),'ss'))
) as secs,

add(
   mul(60,to_int(to_string(to_timestamp(date,time),'hh'))),
   to_int(to_string(to_timestamp(date,time),'mm'))
) as minu,

to_int(to_string(to_timestamp(date,time),'yy')) as yy,
to_int(to_string(to_timestamp(date,time),'MM')) as mo,
to_int(to_string(to_timestamp(date,time),'dd')) as dd,
to_int(to_string(to_timestamp(date,time),'hh')) as hh,
to_int(to_string(to_timestamp(date,time),'mm')) as mi,
to_int(to_string(to_timestamp(date,time),'ss')) as ss,
to_lowercase(EXTRACT_PATH(cs-uri-stem)) as fpath,
to_lowercase(EXTRACT_FILENAME(cs-uri-stem)) as fname,
to_lowercase(EXTRACT_EXTENSION(cs-uri-stem)) as fext

from e:\logs\iis_www\W3SVC1045333159\*.log

where sc-status<>401 and date BETWEEN TO_TIMESTAMP(%startdate%, 'yyyy-MM-dd') and TO_TIMESTAMP(%enddate%, 'yyyy-MM-dd')

After choosing the appropriate script and modifying the second last line, save this file into the Log parser installation folder and call it GETSECONDS.TXT.

For the three readers who *really* want to know, the key part of what this does is to take the timestamp of each log entry and turn it into what second of the day it is and what minute of the day it is. So assuming the timestamp is 8:35am at the 34 second park, the formula effectively adds together:

  • 8 * 3600 (since there are 3600 seconds in an hour)
  • 35 * 60 (60 seconds in a minute)
  • 34 seconds

= 30934 seconds

  • 8 * 60 (60 minutes in an hour)
  • 35 minutes

= 515 minutes

Now that we have our GETSECONDS.TXT script ready, let’s use Log parser to generate our file that we will use for reporting. Open a command prompt (for later versions of windows make sure it is an administrator command prompt) and change directory to the LogParser installation location.

C:\Program Files (x86)\Log Parser 2.2>

Now decide a date to report on. In my example, the logs go back two years and I only want the the 15th of November 2011. The format for the dates MUST be “yyyy-mm-dd” (e.g. 2011-11-15).

Type in the following command (substituting whatever date range interests you):

logparser -i:IISW3C file:GetSeconds.txt?startdate=’2011-11-15’+enddate=’2011-11-15′ -o:csv >e:\temp\LogWithSeconds.csv

  • The –i parameter specifies the type of input file. In this case the input file is IISW3C (IIS weblog format)
  • The ?startdate parameter specifies the start  date you want to process
  • The +enddate parameter specifies the end date you want to process
  • The –o parameter specifies the type of output file. In this case the output file is CSV format
  • The –q parameter says not to prompt the user for anything
  • The >LogWithSeconds.csv says to save the CSV output into a file called LogsWithSeconds.csv

So depending on how many logfiles you had in your logs folder, things may take a while to process. Be patient here… after all, it might be processing years of logfiles (and now you know why we didn’t do this in a production install!). Also be warned, the resulting LogWithSeconds.csv that is created will be very very big if you specified a wide date range. Whatever you do, do not open this file with notepad if its large! We will be using additional log parser scripts to interrogate it instead.

Conclusion

Right! If you got this far and your normally not a command line kind of person… well done! If you are a developer, thanks for sticking with me. You should have a newly minted file called LogWithSeconds.csv and you are ready to do some interrogation of it. In the next post, I will outline some more logparser scripts that generate some useful information!

Until then, thanks for reading

Paul Culmsee

p.s Why not check out my completely non SharePoint book entitled “The Heretics Guide to Best Practices”. It recently won a business book award.


Demystifying SharePoint Performance Management Part 2 – So what is RPS anyway?

Hi all

I never mentioned it in the first post that the reason I am blogging again is I finally completed most of the game Skyrim. Man – that game is dangerous if you value your time!

Anyway, in the first post, I introduced this series by covering the difference between lead and lag performance indicators. To recap from part 1, a lead indicator is something that can help predict an outcome by measuring an action, whereas a lag indicator measures the result or outcome achieved from taking an action. This distinction is important to understand, because otherwise it is easy to use performance measurements inappropriately or get very confused. Lead indicators in particular sometimes feel wishy washy because it is hard to have a direct correlation to what you are seeing.

In this post, we are going to examine one of the most commonly cited (and abused) lead indicators to measure for performance. Good old Requests Per Second (RPS). Let’s attempt to make this more clear…

Microsoft defines RPS as:

The number of requests received by a farm or server in one second. This is a common measurement of server and farm load. The number of requests processed by a farm is greater than the number of page loads and end-user interactions. This is because each page contains several components, each of which creates one or more requests when the page is loaded. Some requests are lighter than other requests with regard to transaction costs. In our lab tests and case study documents, we remove 401 requests and responses (authentication handshakes) from the requests that were used to calculate RPS because they have insignificant impact on farm resources

So according to this definition, RPS is any interaction between browsers (or any other device or service making web requests) and the SharePoint webserver, excluding authentication traffic. The logic of measuring requests per second is that it provides insight into how much load your SharePoint box can take because, after all, SharePoint at the end of the day is servicing requests from users.

RPS by example

Before we start picking apart RPS and its issues, let’s look at an example. Assuming you are viewing this page in Internet Explorer version 8 or 9, press F12 right now. You should see something like the screen below. If you have not seen it before, it is called the internet explorer developer tools and is bloody handy. Now click on the “Network” link, highlighted below and then click the “Start capturing” button.

image

Now refresh this page and watch the result. You should see a bunch of activity logged, looking something like the picture below.

image

What you are looking at is all of the requests that your browser has made to load this very page. While the detail is not overly important for the purpose of this post, the key point is that to load this page, many requests were made. In fact if you look in the left-bottom corner of the above screenshot, a total of 130 individual requests are listed.

So, first pop-quiz for the day: Were all 130 requests made to my cleverworkarounds blog to refresh this page? The answer my friends is no. In actual fact, only 2 items were loaded from my blog!

So why the discrepancy? What happened to the other 128 requests? Two main reasons.

1. Browser cache: First up, many of the items listed above were cached by my browser already. I’ve been to this site before, and so a lot of the page components (CSS style sheets, logos and the like) did not have to be retrieved again. It just happens that the internet explorer developer tool shows requests that were handled by locally cached data as well as actual requests made to SharePoint. If you look closely at the “Result” column in the above screenshot, you will see that some entries are grey colour while others are black. All of the grey entries are cached requests. They never left the confines of the browser. This alone accounts for 95 of the 130 requests.

Now this is worth consideration because if a browser has never accessed this site before, there will be no content in the browser cache. Therefore, on first access, the browser would indeed have made 95 additional requests to load the page. This scenario is most likely on day one of a production SharePoint rollout, where a large chunk of the workforce might load the homepage for the first time.

2. Content from other sites: The second reason for the discrepancy is that some content doesn’t even come from the cleverworkarounds site. Anytime you visit a blog and it has a snazzy widget like Amazon books or Facebook “like” buttons, that content is very likely being retrieved from Amazon or Facebook. In the case of this very article you are reading, 33 requests were made to other sites like Facebook, amazon, feedburner, sharepointads and whoever else happens to grace a widget on the right hand side. In these cases, my server is not handling this traffic at all. This accounts for 33 of the 130 requests.

95 + 33 = 128 of the 130 requests made.

So hopefully now you get what is meant by RPS. Let’s now look at its utility in measuring performance.

Dangers of RPS reliance…

Consider two fairly typical SharePoint transactions: The first example is loading the SharePoint home page and the second example is where a user loads a document from a SharePoint document library. Below I have compared the two transactions by using an Office 365 site of mine and capturing the requests made by each one. (For what its worth, I used a utility called fiddler rather than the developer toolbar because it has some snazzier features).

In example #1, we have loaded the homepage of an Office365 site (assuming for the first time). In all, 36 requests made to the server. If we add up the amount of data returned by the server (summing the “Body” column below), we have a total of 245,322 bytes received.

image

In request #2, we are looking at the trace of me opening a 7 megabyte document from a document library. Notice that this time, 17 requests were. But compared to the first example, significantly more data was returned from the server: 7,245,876 KB in fact. If you drill down further by examining the “Body” column, you will notice that of those 17 requests, 3 of them were the bulk of the data transferred with 3,149,348, 3,148,008 and 891,069 KB respectively.

image

So here is my point. Some requests are more significant than others! In the latter example, 3 of the 17 requests transferred 98% of the data. The second transaction also took much longer than the first, and the data was retrieved from the SQL Server database, which meant that this interaction with SharePoint likely had more back-end performance load than the first example when the home page was loaded. When loading the home page, the data may have been served from one of the many SharePoint caches and barely touching the back-end SQL box.

Now with that in mind, consider this: The typical rationale you see around the interweb for utilising RPS as a performance tool is to estimate future scalability requirements. Statements like "This SharePoint farm needs to be capable of 125RPS” are fairly common. Traditionally, the figure was derived from a methodology that looked something like:

  1. Work out the peak times of the day for SharePoint site usage (for example between 10:45am-2:45pm each day)
  2. Estimate the number of concurrent users accessing your SharePoint site during this time
  3. Classify the users via their usage profile (wussy, light, heavy, psycho, etc)
  4. Estimate how many transactions each of these user types might make in the peak hour (a transaction being an operation like browse home page, edit document, and so on)
  5. Multiply concurrent users by the number of expected transactions to derive the total number of transactions for the period
  6. Divide the total by the number of seconds in the period to work out how many transactions per second.

There are lots of issues with this methodology, but here are 4 obvious ones.

  1. The first is that it confuses transactions with requests. While browsing the SharePoint home page might be considered one “transaction”, it will likely consist of more than one request (particularly if the content being served is designed to be fairly dynamic and not rely on cache data). Essentially this methodology may underestimate the number of requests because it assumes a 1:1 relationship between a transaction and a request. My two examples above demonstrate that this is not the case.
  2. The classification of usage profile of users (light, medium, heavy) is crude and overlooks the aforementioned variation in usage patterns. A “heavy user” might continually update a SharePoint calendar, while a “light” user might load 20 megabyte documents or run sophisticated reports. In both cases, the real load on the infrastructure – and the resulting response time – may be quite varied.
  3. It fails to take into consideration the fact that SharePoint 2010 in particular has many new features in the form of Service Applications. These also make requests behind the scenes that have load implications. The most obvious example is the search crawling SharePoint sites.
  4. It also overlooks the fact that SharePoint content is often accessed indirectly. Many non-browser client tools such as SharePoint Workspace, OneNote, Outlook Social Connector, Harmon.ie and the like. If Colligo Contributor is deployed to all desktops, does that make all users “heavy?”

So hopefully by now, you can understand the folly of saying to someone “This system should be capable of handling 150RPS.” There is simply far too many variables that contribute to this, and each request can be wildly different in terms of real load on the back-end servers. Now you know why Robert Bogue likened this issue to Drakes Equation in part 1. The RPS target arrived at utilising this sort of methodology is likely to be fairly inaccurate and of questionable value.

So what is RPS good for and how do I get it?

So am I anti RPS? Definitely not!

The one thing RPS has going for it, which makes it incredibly useful, is that it is likely to be the one performance metric that any organisation can tap into straight away (assuming you have an existing deployment). This is because the metric is collected in web server (IIS) logs over time. Each request made to the server is logged with a date and timestamp. For most places, this is the only high fidelity performance data you have access to, because many organisations do not collect and store other stats like CPU and Disk IO performance over time. While its unlikely you would be able to see CPU for a server 6 months ago on Tuesday at 9:53am, chances are you can work out the RPS at that time if you have an existing intranet or portal. The reason for this is that IIS logs are not cleared so you have the opportunity to go back in time and see how a SharePoint site has been utilised.

The benefit is that we have the means to understand past performance patterns of an organisations use of their intranet or portal. We can work out stuff like:

  • peak times of the day for usage of the portal based on previous history
  • the maximum number of requests that the server has ever had to process
  • the rate of increase/decrease of RPS over time (ie “What was peak RPS 6 months ago?  What was it 3 months ago?)
  • the patterns/distribution of requests over a typical day (peaks and troughs – we can see the “shape” of SharePoint usage over a given period)

As an added bonus, the data in web server logs allow for some other fringe benefits including stuff like:

  • the percentage or pattern of requests were “non interactive” (such as % of requests that are search crawls or SharePoint workspace sync’s)
  • identifying usage patterns of certain users (eg top 10 users and their usage usage patterns)

Finally, if you monitor CPU and disk performance, you can compare the RPS peaks against those other performance counters and then interpolate how things might have been in the past (although this has some caveats too).

Coming up next…

Okay so now you are convinced that RPS does not suck – and you want to get your hands on all this RPS goodness. The good news is that its fairly easy to do and Microsoft’s Mike Wise has documented the definitive way to do it. The bad news is, you have to download and learn a yet another utility. Fear not though as the utility (called LogParser) is brilliant and needs to be in your arsenal anyway (especially business oriented SharePoint readers of this blog – this is not one just for the techies). Put simply, LogParser provides the ability to do SQL-like queries to your log files. You can have it open a log file (or series of files), process them via a SQL style language, and then output the results of your query into different formats for reporting.

But, just as I have whetted your appetite, I am going to stop.This post is already getting large and I still have a bit to get through in relation to using LogParser, so I will focus on that in the next post.

Hopefully though at this point, you don’t totally hate RPS, have a much better idea of what RPS is and some of the issues of its use.

Thanks for reading

Paul Culmsee

www.hereticsguidebooks.com


The cloud isn’t the problem–Part 6: The pros and cons of patriotism

Hi all and welcome to my 6th post on the weird and wonderful world of cloud computing. The recurring theme in this series has been to point out that the technological aspects of cloud computing have never really been the key issue. Instead, I feel It is everything else around the technology, ranging from immature process, through to the effects of the industry shakeout and consolidation, through to the adaptive change required for certain IT roles. To that end, in the last post, we had fun at the expense of server huggers and the typical defence mechanisms they use to scare the rest of the organization into fitting into their happy-place world of in-house managed infrastructure. In that post I made a note on how you can tell an IT FUD defence because risk averse IT will almost always try use their killer argument up-front to bury the discussion. For many server huggers or risk averse IT, the killer defence is US Patriot Act Issue.

Now just in case you have never been hit with the “…ah but what about the Patriot Act?” line and have no idea what the Patriot Act is all about, let me give you a nice metaphor. It is basically a legislative version of the “Men in Black” movies. Why Men in Black? Because in those movies, Will Smith and Tommy Lee Jones had the ability to erase the memories of anyone who witnessed any extra-terrestrial activity with that silvery little pen-like device. With the Patriot Act, US law enforcement now has a similar instrument. Best of all, theirs doesn’t need batteries – it is all done on paper.

image

In short, the Patriot Act provides a means for U.S. law enforcement agencies, to seek a court order allowing access to the personal records of anyone without their knowledge, provided that it is in relation to an anti-terrorism investigation. This act applies to pretty much any organisation who has any kind of presence in the USA and the rationale behind introducing it was to make it much easier for agencies to conduct terrorism investigations and better co-ordinate their efforts. After all, in the reflection and lessons learnt from the 911 tragedy, the need for for better inter-agency co-ordination was a recurring theme.

The implication of this act is for cloud computing should be fairly clear. Imagine our friendly MIB’s Will Smith (Agent J) and Tommy Lee Jones (Agent K) bursting into Google’s headquarters, all guns blazing, forcing them to hand over their customers data. Then when Google staff start asking too many questions, they zap them with the memory eraser gizmo. (Cue Tommy Lee jones stating “You never saw us and you never handed over any data to us.” )

Scary huh? It’s the sort of scenario that warms the heart of the most paranoid server hugger, because surely no-one in their right mind could mount a credible counter-argument to that sort of risk to the confidentiality and integrity of an organisations sensitive data.

But at the end of the day, cloud computing is here to stay and will no doubt grow. Therefore we need to unpack this issue and see what lies behind the rhetoric on both sides of the debate. Thus, I decided to look into the Patriot act a bit further to understand it better. Of course, it should be clear here that I am not a lawyer, and this is just my own opinions from my research and synthesis of various articles, discussion papers and interviews. My personal conclusion is that all the hoo-hah about the Patriot Act is overblown. Yet in stating this, I have to also state that we are more or less screwed anyway (and always were). As you will see later in this post, there are great counter arguments that pretty much dismantle any anti-cloud arguments that are FUD based, but be warned – in using these arguments, you will demonstrate just how much bigger this thing is beyond cloud computing and get a sense of the broader scale of the risk.

So what is the weapon?

The first thing we have to do is understand some specifics about the Patriot Act’s memory erasing device. Within the vast scope of the act, the two areas for greatest concern in relation to data is the National Security Letter and the Section 215 order. Both provide authorities access to certain types of data and I need to briefly explain them:

A National Security Letter (NSL) is a type of subpoena that permits certain law enforcement agencies to compel organisations or individuals to provide certain types of information like financial and credit records, telephone and ISP records (Internet searches, activity logs, etc). Now NSL’s existed prior to the Patriot Act, but the act loosened some of the controls that previously existed. Prior to the act, the information being sought had to be directly related a foreign power or the agent of a foreign power – thereby protecting US citizens. Now, all agencies have to do is assert that the data being sought is relevant in some way to any international terrorism or foreign espionage investigations.

Want to see what a NSL looks like? Check this redacted one from wikipedia.

A Section 215 Order is similar to an NSL in that it is an instrument that law enforcement agencies can use to obtain data. It is also similar to NSL’s in that it existed prior to the Patriot Act – except back then it was called a FISA Order – named after the Foreign Intelligence Surveillance Act that enacted it. The type of data available under a Section 215 Order is more expansive than what you can eke out of an NSL, but a Section 215 Order does require a judge to let you get hold of it (i.e. there is some judicial oversight). In this case, the FBI obtains a 215 order from the Foreign Intelligence Surveillance Court which reviews the application. What the Patriot Act did different to the FISA Order was to broaden the definition of what information could be sought. Under the Patriot Act, a Section 215 Order can relate to “any tangible things (including books, records, papers, documents, and other items).” If these are believed to be relevant to an authorised investigation they are fair game. The act also eased the requirements for obtaining such an order. Previously, the FBI had to present “specific articulable facts” that provided evidence that the subject of an investigation was a “foreign power or the agent of a foreign power.” From my reading, now there is no requirement for evidence and the reviewing judge therefore has little discretion. If the application meets the requirements of Section 215, they will likely issue the order.

So now that we understand the two weapons that are being wielded, let’s walk through the key concerns being raised.

Concern 1: Impacted cloud providers can’t guarantee that sensitive client data won’t be turned over to the US government

CleverWorkArounds short answer:

Yes this is dead-set true and it has happened already.

CleverWorkArounds long answer:

This concern stems from the “loosening” of previous controls on both NSL’s and Section 215 Orders. NSL’s for example, require no probable cause or judicial oversight at all, meaning that the FBI can issue these at their own volition. Now it is important to note that they could do this before the Patriot Act came into being too, but back then the parameters for usage was much stricter. Section 215 Orders on the other hand, do have judicial oversight, but that oversight has also been watered down. Additionally the breadth of information that can be collected is now greater. Add to that the fact that both NSL’s and Section 215 Orders almost always include a compulsory non-disclosure or “gag” order, preventing notification to the data owner that this has even happened.

This concern is not only valid but it has happened and continues to happen. Microsoft has already stated that it cannot guarantee customers would be informed of Patriot Act requests and furthermore, they have also disclosed that they have complied with Patriot Act requests. Amazon and Google are in the same boat. Google also have also disclosed that they have handed data stored in European datacenters back to U.S. law enforcement.

Now some of you – particularly if you live or work in Europe – might be wondering how this could happen, given the European Union’s strict privacy laws. Why is it that these companies have complied with the US authorities regardless of those laws?

That’s where the gag orders come in – which brings us onto the second concern.

Concern 2: The reach of the act goes beyond US borders and bypasses foreign legislation on data protection for affected providers

CleverWorkArounds short answer:

Yes this is dead-set true and it has happened already.

CleverWorkArounds long answer:

The example of Google – a US company – handing over data in its EU datacentres to US authorities, highlights that the Patriot Act is more pervasive than one might think. In terms of who the act applies to, a terrific article put out by Alex C. Lakatos put it really well when he said.

Furthermore, an entity that is subject to US jurisdiction and is served with a valid subpoena must produce any documents within its “possession, custody, or control.” That means that an entity that is subject to US jurisdiction must produce not only materials located within the United States, but any data or materials it maintains in its branches or offices anywhere in the world. The entity even may be required to produce data stored at a non-US subsidiary.

Think about that last point – “non-US subsidiary”.  This gives you a hint to how pervasive this is. So in terms of jurisdiction and whether an organisation can be compelled to hand over data and be subject to a gag order, the list is expansive. Consider these three categories:

  • – US based company? Absolutely: That alone takes out Apple, Amazon, Dell, EMC (and RSA), Facebook, Google, HP, IBM, Symantec, LinkedIn, Salesforce.com, McAfee, Adobe, Dropbox and Rackspace
  • – Subsiduary company of a US company (incorporated anywhere else in the world)? It seems so.
  • – Non US company that has any form of US presence? It also seems so. Now we are talking about Samsung, Sony, Nokia, RIM and countless others.

The crux of this argument about bypassing is the gag order provisions. If the US company, subsidiary or regional office of a non US company receives the order, they may be forbidden from disclosing anything about it to the rest of the organisation.

Concern 3: Potential for abuse of Patriot Act powers by authorities

CleverWorkArounds short answer:

Yes this is true and it has happened already.

CleverWorkArounds long answer:

Since the Patriot Act came into place, there was a significant marked increase in the FBI’s use of National Security Letters. According to this New York Times article, there were 143,000 requests  between 2003 to 2005. Furthermore, according to a report from the Justice Department’s Inspector General in March 2007, as reported by CNN, the FBI was guilty of “serious misuse” of the power to secretly obtain private information under the Patriot Act. I quote:

The audit found the letters were issued without proper authority, cited incorrect statutes or obtained information they weren’t supposed to. As many as 22% of national security letters were not recorded, the audit said. “We concluded that many of the problems we identified constituted serious misuse of the FBI’s national security letter authorities,” Inspector General Glenn A. Fine said in the report.

The Liberty and Security Coalition went into further detail on this. In a 2009 article, they list some of the specific examples of FBI abuses:

  • – FBI issued NSLs when it had not opened the investigation that is a predicate for issuing an NSL;
  • – FBI used “exigent letters” not authorized by law to quickly obtain information without ever issuing the NSL that it promised to issue to cover the request;
  • – FBI used NSLs to obtain personal information about people two or three steps removed from the subject of the investigation;
  • – FBI has used a single NSL to obtain records about thousands of individuals; and
  • – FBI retains almost indefinitely the information it obtains with an NSL, even after it determines that the subject of the NSL is not suspected of any crime and is not of any continuing intelligence interest, and it makes the information widely available to thousands of people in law enforcement and intelligence agencies.

Concern 4: Impacted cloud providers cannot guarantee continuity of service during investigations

CleverWorkArounds short answer:

Yes this is dead-set true and it has happened already.

CleverWorkArounds long answer:

An oft-overlooked side effect of all of this is that other organisations can be adversely affected. One aspect of cloud computing scalability that we talked about in part 1 is that of multitenancy. Now consider a raid on a datacenter. If cloud services are shared between many tenants, innocent tenants who had nothing whatsoever to do with the investigation can potentially be taken offline. Furthermore, the hosting provider may be gagged from explaining to these affected parties what is going on. Ouch!

An example of this happening was reported in the New York TImes in mid 2011 and concerned Curbed Network, a New York blog publisher. Curbed, along with some other companies, had their service disrupted after an F.B.I. raid on their cloud providers datacenter. They were taken down for 24 hours because the F.B.I.’s raid on the hosting provider seized three enclosures which, unfortunately enough, included the gear they ran on.

Ouch! Is there any coming back?

As I write this post, I wonder how many readers are surprised and dismayed by my four risk areas. The little security guy in me says If you are then that’s good! It means I have made you more aware than you were previously which is a good thing. I also wonder if some readers by now are thinking to themselves that their paranoid server huggers are right?

To decide this, let’s now examine some of the the counter-arguments of the Patriot Act issue.

Rebuttal 1: This is nothing new – Patriot Act is just amendments to pre-existing laws

One common rebuttal is that the Patriot Act legislation did not fundamentally alter the right of the government to access data. This line of argument was presented in August 2011 by Microsoft legal counsel Jeff Bullwinkel in Microsoft Australia’s GovTech blog. After all, it was reasoned, the areas frequently cited for concern (NSL’s and Section 215/FISA orders) were already there to begin with. Quoting from the article:

In fact, U.S. courts have long held that a company with a presence in the United States is obligated to respond to a valid demand by the U.S. government for information – regardless of the physical location of the information – so long as the company retains custody or control over the data. The seminal court decision in this area is United States v. Bank of Nova Scotia, 740 F.2d 817 (11th Cir. 1984) (requiring a U.S. branch of a Canadian bank to produce documents held in the Cayman Islands for use in U.S. criminal proceedings)

So while the Patriot Act might have made it easier in some cases for the U.S. government to gain access to certain end-user data, the right was always there. Again quoting from Bullwinkel:

The Patriot Act, for example, enabled the U.S. government to use a single search warrant obtained from a federal judge to order disclosure of data held by communications providers in multiple states within the U.S., instead of having to seek separate search warrants (from separate judges) for providers that are located in different states. This streamlined the process for U.S. government searches in certain cases, but it did not change the underlying right of the government to access the data under applicable laws and prior court decisions.

Rebuttal 2: Section 215’s are not often used and there are significant limitations on the data you can get using an NSL.

Interestingly, it appears that the more powerful section 215 orders have not been used that often in practice. The best article to read to understand the detail is one by Alex Lakatos. According to him, less than 100 applications for section 215 orders were made in 2010. He says:

In 2010, the US government made only 96 applications to the Foreign Intelligence Surveillance Courts for FISA Orders granting access to business records. There are several reasons why the FBI may be reluctant to use FISA Orders: public outcry; internal FBI politics necessary to obtain approval to seek FISA Orders; and, the availability of other, less controversial mechanisms, with greater due process protections, to seek data that the FBI wants to access. As a result, this Patriot Act tool poses little risk for cloud users.

So while section 215 orders seem less used, NSL’s seem to be used a dime a dozen – which I suppose is understandable since you don’t have to deal with a pesky judge and all that annoying due process. But the downside of NSL’s from a law enforcement point of view is that the the sort of data accessible via the NSL is somewhat limited. Again quoting from Lakatos (with emphasis mine):

While the use of NSLs is not uncommon, the types of data that US authorities can gather from cloud service providers via an NSL is limited. In particular, the FBI cannot properly insist via a NSL that Internet service providers share the content of communications or other underlying data. Rather [.] the statutory provisions authorizing NSLs allow the FBI to obtain “envelope” information from Internet service providers. Indeed, the information that is specifically listed in the relevant statute is limited to a customer’s name, address, and length of service.

The key point is that the FBI has no right to content via an NSL. This fact may not stop the FBI from having a try at getting that data anyway, but it seems that savvy service providers are starting to wise up to exactly what information an NSL applies to. This final quote from the Lakato article summarises the point nicely and at the same time, offers cloud providers a strategy to mitigate the risk to their customers.

The FBI often seeks more, such as who sent and received emails and what websites customers visited. But, more recently, many service providers receiving NSLs have limited the information they give to customers’ names, addresses, length of service and phone billing records. “Beginning in late 2009, certain electronic communications service providers no longer honored” more expansive requests, FBI officials wrote in August 2011, in response to questions from the Senate Judiciary Committee. Although cloud users should expect their service providers that have a US presence to comply with US law, users also can reasonably ask that their cloud service providers limit what they share in response to an NSL to the minimum required by law. If cloud service providers do so, then their customers’ data should typically face only minimal exposure due to NSLs.

Rebuttal 3: Too much focus on cloud data – there are other significant areas of concern

This one for me is a perverse slam-dunk counter argument that puts the FUD defence of a server hugger back in its box. The reason it is perverse is that it opens up the debate that for some server huggers, may mean that they are already exposed to the risks they are raising. You see, the thing to always bear in mind is that the Patriot Act applies to data, not just the cloud. This means that data, in any shape or form is susceptible in some circumstances if a service provider exercises some degree of control over it. When you consider all the applicable companies that I listed earlier in the discussion like IBM, Accenture, McAfee, EMC, RIM and Apple, you then start to think about the other services where this notion of “control” might come into play.

What about if you have outsourced your IT services and management to IBM, HP or Accenture? Are they running your datacentres? Are your executives using Blackberry services? Are you using an outsourced email spam and virus scanning filter supplied by a security firm like McAfee? Using federated instant messaging? Performing B2B transactions with a US based company?

When you start to think about all of the other potential touch-points where control over data is exercised by a service provider, things start to look quite disturbing. We previously established that pretty much any organisation with a US interest (whether US owned or not), falls under Patriot Act jurisdiction and may be gagged from disclosing anything. So sure. . .cloud applications are a potential risk, but it may well be that any one of these companies providing services regarded as “non cloud” might receive an NSL or section 215 order with a gag provision, ordering them to hand over some data in their control. In the case of an outsourced IT provider, how can you be sure that the data is not straight out of your very own datacenter?

Rebuttal 4: Most other countries have similar laws

It also turns out that many other jurisdictions have similar types of laws. Canada, the UK, most countries in the EU, Japan and Australia are some good examples. If you want to dig into this, examine Clive Gringa’s article on the UK’s Regulation of Investigatory Powers Act 2000 (RIPA) and an article published by the global law firm Linklaters (a SharePoint site incidentally), on the legislation of several EU countries.

In the UK, RIPA governs the prevention and detection of acts of terrorism, serious crime and “other national security interests”. It is available to security services, police forces and authorities who investigate and detect these offenses. The act regulates interception of the content of communications as well as envelope information (who, where and when). France has a bunch of acts which I won’t bore you too much with, but after 911, they instituted act 2001-1062 of 15 November 2001 which strengthens the powers of French law enforcement agencies. Now agencies can order anyone to provide them with data relevant to an inquiry and furthermore, the data may relate to a person other than the one being subject to the disclosure order.

The Linklaters article covers Spain and Belgium too and the laws are similar in intent and power. They specifically cite a case study in Belgium where the shoe was very much on the other foot. US company Yahoo was fined for not co-operating with Belgian authorities.

The court considered that Yahoo! was an electronic communication services provider (ESP) within the meaning of the Belgian Code of Criminal Procedure and that the obligation to cooperate with the public prosecutor applied to all ESPs which operate or are found to operate on Belgian territory, regardless of whether or not they are actually established in Belgium

I could go on citing countries and legal cases but I think the point is clear enough. Smile

Rebuttal 5: Many countries co-operate with US law enforcement under treaties

So if the previous rebuttal argument that other countries have similar regimes in place is not convincing enough, consider this one. Lets assume that data is hosted by a major cloud services provider with absolutely zero presence in, or contacts with, the United States. There is still a possibility that this information may still be accessible to the U.S. government if needed in connection with a criminal case. The means by which this can happen is via international treaties relation to legal assistance. These are called Mutual Assistance Legal Treaties (MLAT).

As an example, US and Australia have had a longstanding bilateral arrangement. This provides for law enforcement cooperation between the two countries and under this arrangement, either government can potentially gain access to data located within the territory of the other. To give you an idea of what such a treaty might look like consider the scope of the Australia-US one. The scope of assistance is wide and I have emphasised the more relevant ones:

  • (a) taking the testimony or statements of persons;
  • (b) providing documents, records, and other articles of evidence;
  • (c) serving documents;
  • (d) locating or identifying persons;
  • (e) transferring persons in custody for testimony or other purposes;
  • (f) executing requests for searches and seizures and for restitution;
  • (g) immobilizing instrumentalities and proceeds of crime;
  • (h) assisting in proceedings related to forfeiture or confiscation; and
  • (i) any other form of assistance not prohibited by the laws of the Requested State.

For what its worth, if you are interested in the boundaries and limitations of the treaty, it states that the “Central Authority of the Requested State may deny assistance if”:

  • (a) the request relates to a political offense;
  • (b) the request relates to an offense under military law which would not be an offense under ordinary criminal law; or
  • (c) the execution of the request would prejudice the security or essential interests of the Requested State.

Interesting huh? Even if you host in a completely independent country, better check the treaties they have in place with other countries.

Rebuttal 6: Other countries are adjusting their laws to reduce the impact

The final rebuttal to the whole Patriot Act argument that I will cover is that things are moving fast and countries are moving to mitigate the issue regardless of the points and counterpoints that I have presented here. Once again I will refer to an article from Alex Lakatos, who provides a good example. Lakatos writes that the EU may re-write their laws to ensure that it would be illegal for the US to invoke the Patriot Act in certain circumstances.

It is anticipated, however, that at the World Economic Forum in January 2012, the European Commission will announce legislation to repeal the existing EU data protection directive and replace it with more a robust framework. The new legislation might, among other things, replace EU/US Safe Harbor regulations with a new approach that would make it illegal for the US government to invoke the Patriot Act on a cloud-based or data processing company in efforts to acquire data held in the European Union. The Member States’ data protection agency with authority over the company’s European headquarters would have to agree to the data transfer.

Now Lakatos cautions that this change may take a while before it actually turns into law, but nevertheless is something that should be monitored by cloud providers and cloud consumers alike.

Conclusion

So what do you think? Are you enlightened and empowered or confused and jaded? Smile

I think that the Patriot Act issue is obviously a complex one that is not well served by arguments based on fear, uncertainty and doubt. The risks are real and there are precedents that demonstrate those risks. Scarily, it doesn’t make much digging to realise that those risks are more widespread than one might initially consider. Thus, if you are going to play the Patriot Act card for FUD reasons, or if you are making a genuine effort to mitigate the risks, you need to look at all of the touch points where service provider might exercise a degree of control. They may not be where you think they are.

In saying all of this, I think this examination highlights some strategy that can be employed by cloud providers and cloud consumers alike. Firstly, If I were a cloud provider, I would state my policy about how much data will be given when confronted by an NSL (since that has clear limitations). Many providers may already do this, so to turn it around to the customer, it is incumbent on cloud consumers to confirm with the providers as to where they stand. I don’t know if there is that much value in asking a cloud provider if they are exempt from the reach of the Patriot Act. Maybe its better to assume they are affected and instead, ask them how they intend to mitigate their customers downlevel risks.

Another obvious strategy for organisations is to encrypt data before it is stored on cloud infrastructure. While that is likely not going to be an option in a software as a service model like Office 365, it is certainly an option in the infrastructure and platform as a service models like Amazon and Azure. That would reduce the impact of a Section 215 Order being executed as the cloud provider is unlikely going to have the ability to decrypt the data.

Finally (and to sound like a broken record), a little information management governance would not go astray here. Organisations need to understand what data is appropriate for what range of cloud services. This is security 101 folks and if you are prudent in this area, cloud shouldn’t necessarily be big and scary.

Thanks for reading

Paul Culmsee

www.hereticsguidebooks.com

www.sevensigma.com.au

p.s Now do not for a second think this article is exhaustive as this stuff moves fast. So always do your research and do not rely on an article on some guys blog that may be out of date before you know it.


An obscure “failed to create the configuration database” issue…

Hi all

You would think that after years of installing SharePoint in various scenarios, that I would be able to get past step 3 in the configuration wizard (the step that creates the configuration database). But today I almost got nailed by an issue that – while in hindsight is dead-set obvious – was rather difficult to diagnose.

Basically it was a straightforward two server farm installation. The installer account had local admin rights on the web front end server and sysadmin rights on the SQL box. SQL was a dedicated named instance using an alias. I was tutoring the install while an engineer did the driving and as soon as we hit step 3, blammo! – the Installation failed claiming that the configuration database could not be created.

image

Looking a little deeper into the log, the error message stated:

An error occurred while getting information about the user svc-spfarm at server mydomain.com: Access is denied

Hmm.. After double checking all the obvious things (SQL dbcreator and securityadmin on the farm account, group policy interference, etc) it was clear this was something different. The configuration database was successfully created on the SQL server, although the permissions of the farm account had not been applied. This proved that SQL permissions were appropriate. Clearly this was an issue around authentication and active directory.

There were very few reports of similar symptoms online and the closest I saw was a situation where the person ran the SharePoint configuration wizard using the local machine administrator account by mistake, rather than a domain account. Of course, the local account had no rights to access active directory and the wizard had failed because it had no way to verify the SharePoint farm account in AD to grant it permissions to the configuration database. But in this case we were definitely using a valid domain account.

As part of our troubleshooting, we opted to explicitly give the farm account “Log on as a service” rights (since this is needed for provisioning the user profile service later anyhow). It was then we saw some really bizarre behaviour. We were unable to find the SharePoint farm account in Active Directory. Any attempt to add the farm account to the “log on as a service” right would not resolve and therefore we could not assign that right. We created another service account to test this behaviour and and the same thing happened. This immediately smelt like an issue with Active directory replication – where the domain controller being accessed was not replicating with the others domain controllers. A quick repladmin check and we ascertained that all was fine.

Hmm…

At this point, we started experimenting with various accounts, old and new. We were able to conclude that irrespective of the age of the account, some accounts could be found in Active Directory no problem, whereas others could not be. Yet those that could not be found were valid and working on the domain.

Finally one of the senior guys in the organisation realised the problem. In their AD topology, there was an OU for all service accounts. The permissions of that OU had been modified from the default. The “Domain users” group did not have any access to that OU at all. This prevented service accounts from being enumerated by regular domain accounts (a security design they had adopted some time back). Interestingly, even service accounts that live in this OU cannot enumerate any other accounts in that OU, including themselves.

This caused several problems with SharePoint. First the configuration wizard could not finish because it needed to assign the farm account permissions to the config and central admin databases. Additionally, the farm account would not be able to register managed accounts if those accounts were stored in this OU.

Fortunately, when they created this setup, they made a special group called “Enumerate Service Account OU”. By adding the installer account and the farm account to this group all was well.

I have to say, I thought I had seen most of the ways Active Directory configuration might trip me up – but this was a first. Anyone else seen this before?

Thanks for reading

Paul Culmsee

www.sevensigma.com.au

www.hereticsguidebooks.com

p.s The error log detail is below….


Log Name:      Application

Source:        SharePoint 2010 Products Configuration Wizard

Date:          1/02/2012 2:22:52 PM

Event ID:      104

Task Category: None

Level:         Error

Keywords:      Classic

User:          N/A

Computer:      Mycomputer

Description:

Failed to create the configuration database.

An exception of type System.InvalidOperationException was thrown.  Additional exception information: An error occurred while getting information about the user svc-spfarm at server mydomain: Access is denied

System.InvalidOperationException: An error occurred while getting information about the user svc-spfarm at server mydomain

   at Microsoft.SharePoint.Win32.SPNetApi32.NetUserGetInfo1(String server, String name)

   at Microsoft.SharePoint.Administration.SPManagedAccount.GetUserAccountControl(String username)

   at Microsoft.SharePoint.Administration.SPManagedAccount.Update()

   at Microsoft.SharePoint.Administration.SPProcessIdentity.Update()

   at Microsoft.SharePoint.Administration.SPApplicationPool.Update()

   at Microsoft.SharePoint.Administration.SPWebApplication.CreateDefaultInstance(SPWebService service, Guid id, String applicationPoolId, SPProcessAccount processAccount, String iisServerComment, Boolean secureSocketsLayer, String iisHostHeader, Int32 iisPort, Boolean iisAllowAnonymous, DirectoryInfo iisRootDirectory, Uri defaultZoneUri, Boolean iisEnsureNTLM, Boolean createDatabase, String databaseServer, String databaseName, String databaseUsername, String databasePassword, SPSearchServiceInstance searchServiceInstance, Boolean autoActivateFeatures)

   at Microsoft.SharePoint.Administration.SPWebApplication.CreateDefaultInstance(SPWebService service, Guid id, String applicationPoolId, IdentityType identityType, String applicationPoolUsername, SecureString applicationPoolPassword, String iisServerComment, Boolean secureSocketsLayer, String iisHostHeader, Int32 iisPort, Boolean iisAllowAnonymous, DirectoryInfo iisRootDirectory, Uri defaultZoneUri, Boolean iisEnsureNTLM, Boolean createDatabase, String databaseServer, String databaseName, String databaseUsername, String databasePassword, SPSearchServiceInstance searchServiceInstance, Boolean autoActivateFeatures)

   at Microsoft.SharePoint.Administration.SPAdministrationWebApplication.CreateDefaultInstance(SqlConnectionStringBuilder administrationContentDatabase, SPWebService adminService, IdentityType identityType, String farmUser, SecureString farmPassword)

   at Microsoft.SharePoint.Administration.SPFarm.CreateAdministrationWebService(SqlConnectionStringBuilder administrationContentDatabase, IdentityType identityType, String farmUser, SecureString farmPassword)

   at Microsoft.SharePoint.Administration.SPFarm.CreateBasicServices(SqlConnectionStringBuilder administrationContentDatabase, IdentityType identityType, String farmUser, SecureString farmPassword)

   at Microsoft.SharePoint.Administration.SPFarm.Create(SqlConnectionStringBuilder configurationDatabase, SqlConnectionStringBuilder administrationContentDatabase, IdentityType identityType, String farmUser, SecureString farmPassword, SecureString masterPassphrase)

   at Microsoft.SharePoint.Administration.SPFarm.Create(SqlConnectionStringBuilder configurationDatabase, SqlConnectionStringBuilder administrationContentDatabase, String farmUser, SecureString farmPassword, SecureString masterPassphrase)

   at Microsoft.SharePoint.PostSetupConfiguration.ConfigurationDatabaseTask.CreateOrConnectConfigDb()

   at Microsoft.SharePoint.PostSetupConfiguration.ConfigurationDatabaseTask.Run()

   at Microsoft.SharePoint.PostSetupConfiguration.TaskThread.ExecuteTask()


An opportunity to learn about aligning SharePoint to business goals in Vancouver

Hi all

Just a quick note to mention that I’m off travelling again, this time swapping 39 degree Celsius summer weather of Perth for somewhere between –6 to 5 degrees of Canada. I’ll be spending a week in Canada running two classes – one public and one private. The first class is a public SharePoint Governance and Information Architecture class running in Vancouver. MVP Michal Pisarek of SharePointAnalystHQ fame will be there and it should be a terrific two days of learning how to think a little differently to govern SharePoint strategy and deployment. You will learn a bunch of new skills, techniques and perspectives. Best of all, the skills learnt are applicable for many other types of complex projects.

The class flyer is here: http://www.sevensigma.com.au/wp-content/uploads/downloads/2011/02/SPIA.pdf

The registration site is here: http://spiavancouver.eventbrite.com/

In terms of course coverage and content it is worth noting the research performed by the Eventful group (who run the Share conferences). According to them, the hot topic areas for SharePoint are governance, user adoption, change management, information architecture and user empowerment. These sort of topics are the sort where plenty of people tell you what the issues are, but are typically lighter on what to do about them. This class covers why this is, as well as dealing with all of these areas and presents detailed strategies, tools and methods to address them. Furthermore, aside from the 500+ page manual of meaty governance goodness, as a take home, we supply a CD for attendees with a sample performance framework, governance plan, SharePoint ROI calculator and sample mind maps of Information Architecture.

At last count there were 5 places left for the Vancouver class, so if you have been pondering if it is a worthwhile class, check out some of the feedback from the class web site. Also, if you know anybody who might be interested in attending, please pass the course flyer and registration site details to them. We always end up with people who tell us “Ah – if only I knew about the class!!”

Thanks for reading

Paul Culmsee

www.sevensigma.com.au

www.hereticsguidebooks.com


The cloud isn’t the problem–Part 5: Server huggers and a crisis of identity

Hi all

Welcome to my fifth post that delves into the irrational world of cloud computing. After examining the not-so-obvious aspects of Microsoft, Amazon and the industry more broadly, its time to shift focus a little. Now the appeal of the cloud really depends on your perspective. To me, there are three basic motivations for getting in on the act…

  1. I can make a buck
  2. I can save a buck
  3. I can save a buck (and while I am at it, escape my pain-in-the-ass IT department)

If you haven’t guessed it, this post will examine #3, and look at what the cloud means for the the perennial issue of the IT department and business disconnect. I recently read an article over at CIO magazine where they coined the term “Server Huggers” to describe the phenomenon I am about to describe. So to set the flavour for this discussion, let me tell you about the biggest secret in organisational life…

We all have an identity crisis (so get over it).

In organizations, there are roles that I would call transactional (i.e. governed by process and clear KPI’s) and those that are knowledge-based (governed by gut feel and insight). Whilst most roles actually entail both of these elements, most of us in SharePoint land are the latter. In fact we actually spend a lot of time in meeting rooms “strategizing” the solutions that our more transactionally focused colleagues will be using to meet their KPI’s. Beyond SharePoint, this also applies to Business Analysts, Information Architects, Enterprise Architects, Project Managers and pretty much anyone with the word “senior”, “architect”, “analyst”  or “strategic” in their job title.

But there is a big, fat, elephant in the “strategizing room” of certain knowledge worker roles that is at the root of some irrational organisational behaviour. Many of us are suffering a role-based identity crisis. To explain this, lets pick a straw-man example of one of the most conflicted roles of all right now: Information Architects.

One challenge with the craft of IA is pace of change, since IA today looks very different from its library and taxonomic roots. Undoubtedly, it will look very different ten years from now too as it gets assailed from various other roles and perspectives, each believing their version of rightness is more right. Consider this slightly abridged quote from Joshua Porter:

Worse, the term “information architecture” has over time come to encompass, as suggested by its principal promoters, nearly every facet of not just web design, but Design itself. Nowhere is this more apparent than in the latest update of Rosenfeld and Morville’s O’Reilly title, where the definition has become so expansive that there is now little left that isn’t information architecture […] In addition, the authors can’t seem to make up their minds about what IA actually is […] (a similar affliction pervades the SIGIA mailing list, which has become infamous for never-ending definition battles.) This is not just academic waffling, but evidence of a term too broadly defined. Many disciplines often reach out beyond their initial borders, after catching on and gaining converts, but IA is going to the extreme. One technologist and designer I know even referred to this ever-growing set of definitions as the “IA land-grab”, referring to the tendency that all things Design are being redefined as IA.

You can tell when a role is suffering an identity crisis rather easily too. It is when people with the current role start to muse that the title no longer reflects what they do and call for new roles to better reflect the environment they find themselves in. Evidence for this exists further in Porter’s post. Check out the line I marked with bold below:

In addition, this shift is already happening to information architects, who, recognizing that information is only a byproduct of activity, increasingly adopt a different job title. Most are moving toward something in the realm of “user experience”, which is probably a good thing because it has the rigor of focusing on the user’s actual experience. Also, this as an inevitable move, given that most IAs are concerned about designing great things. IA Scott Weisbrod, sees this happening too: “People who once identified themselves as Information Architects are now looking for more meaningful expressions to describe what they do – whether it’s interaction architect or experience designer

So while I used the example of Information Architects as an example of how pace of change causes an identity crisis, the advent of the cloud doesn’t actually cause too many IA’s (or whatever they choose to call themselves) to lose too much sleep. But there are other knowledge-worker roles that have not really felt the effects of change in the same way as their IA cousins. In fact, for the better part of twenty years one group have actually benefited greatly from pace of change. Only now is the ground under their feet starting to shift, and the resulting behaviours are starting to reflect the emergence of an identity crisis that some would say is long overdue.

IT Departments and the cloud

At a SharePoint Saturday in 2011, I was on a panel and we were asked by an attendee what effect Office 365 and other cloud based solutions might have on a traditional IT infrastructure role. This person asking was an infrastructure guy and his question was essentially around how his role might change as cloud solutions becomes more and more mainstream. Of course, all of the SharePoint nerds on the panel didn’t want to touch that question with a bargepole and all heads turned to me since apparently I am “the business guy”. My reply was that he was sensing a change – commoditisation of certain aspects of IT roles. Did that mean he was going to lose his job? Unlikely, but nevertheless when  change is upon us, many of us tend to place more value on what we will lose compared to what we will gain. Our defence mechanisms kick in.

But lets take this a little further: The average tech guy comes in two main personas. The first is the tech-cowboy who documents nothing, half completes projects then loses interest, is oblivious to how much they are in over their head and generally gives IT a bad name. They usually have a lot of intellectual intelligence (IQ), but not so much emotional intelligence (EQ). Ben Curry once referred to this group as “dumb smart guys.” The second persona is the conspiracy theorist who had to clean up after such a cowboy. This person usually has more skills and knowledge than the first guy, writes documentation and generally keeps things running well. Unfortunately, they also can give IT a bad name. This is because, after having to pick up the pieces of something not of their doing, they tend to develop a mother hen reflex based on a pathological fear of being paged at 9pm to come in and recover something they had no part in causing. The aforementioned cowboys rarely last the distance and therefore over time, IT departments begin to act as risk minimisers, rather than business enablers.

Now IT departments will never see it this way of course, instead believing that they enable the business because of their risk minimisation. Having spent 20 years being a paranoid conspiracy theorist, security-type IT guy, I totally get why this happens as I was the living embodiment of this attitude for a long time. Technology is getting insanely complex while users innate ability to do some really risky and dumb is increasing. Obviously, such risk needs to be managed and accordingly, a common characteristic of such an IT department is the word “no” to pretty much any question that involves introducing something new (banning iPads or espousing the evils of DropBox are the best examples I can think of right now). When I wrote about this issue in the context of SharePoint user adoption back in 2008, I had this to say:

The mother hen reflex should be understood and not ridiculed, as it is often the user’s past actions that has created the reflex. But once ingrained, the reflex can start to stifle productivity in many different ways. For example, for an employee not being able to operate at full efficiency because they are waiting 2 days for a helpdesk request to be actioned is simply not smart business. Worse still, a vicious circle emerges. Frustrated with a lack of response, the user will take matters into their own hands to improve their efficiency. But this simply plays into the hands of the mother hen reflex and for IT this reinforces the reason why such controls are needed. You just can’t trust those dog-gone users! More controls required!

The long term legacy of increasing technical complexity and risk is that IT departments become slow-moving and find it difficult to react to pace of change. Witness the number of organisations still running parts of their business on Office 2003, IE6 and Windows XP. The rest of the organisation starts to resent using old tools and the imposition of process and structure for no tangible gain. The IT department develops a reputation of being difficult to deal with and taking ages to get anything done. This disconnect begins to fester, and little by little both IT and “the business” develop a rose-tinged view of themselves (which is known as groupthink) and a misguided perception of the other.

At the end of the day though, irrespective of logic or who has the moral high ground in the debate, an IT department with a poor reputation will eventually lose. This is because IT is no longer seen as a business enabler, but as a cost-center. Just as organisations did with the IT outsourcing fad over the last decade, organisational decision makers will read CIO magazine articles about server huggers look longingly to the cloud, as applications become more sophisticated and more and more traditional vendors move into the space, thus legitimising it. IT will be viewed, however unfairly, as a burden where the cost is not worth the value realised. All the while, to conservative IT, the cloud represents some of their worst fears realised. Risk! risk! risk! Then the vicious circle of the mother-hen reflex will continue because rogue cloud applications will be commissioned without IT knowledge or approval. Now we are back to the bad old days of rogue MSAccess or SharePoint deployments that drives the call for control based governance in the first place!

<nerd interlude>

Now to the nerds reading this post who find it incredibly frustrating that their organisation will happily pump money into some cloud-based flight of fancy, but whine when you want to upgrade the network, I want you to take take note of this paragraph as it is really (really) important! I will tell you the simple reason why people are more willing to spend more money on fluffy marketing than IT. In the eyes of a manager who needs to make a profit, sponsoring a conference or making the reception area look nice is seen as revenue generating. Those who sign the cheques do not like to spend capital on stuff unless they can see that it directly contributes to revenue generation! Accordingly, a bunch of servers (and for that matter, a server room) are often not considered expenditure that generates revenue but are instead considered overhead! Overhead is something that any smart organisation strives to reduce to remain competitive. The moral of the story? Stop arguing cloud vs. internal on what direct costs are incurred because people will not care! You would do much better to demonstrate to your decision makers that IT is not an overhead. Depending on how strong your mother hen reflex is and how long it has been in place, that might be an uphill battle.

</nerd interlude>

Defence mechanisms…

Like the poor old Information Architect, the rules of the game are changing for IT with regards to cloud solutions. I am not sure how it will play out, but I am already starting to see the defence mechanisms kicking in. There was a CIO interviewed in the “Server Huggers” article that I referred to earlier (Scott Martin) who was hugely pro-cloud. He suggested that many CIO’s are seeing cloud solutions as a threat to the empire they have built:

I feel like a lot of CIOs are in the process of a kind of empire building.  IT empire builders believe that maintaining in-house services helps justify their importance to the company. Those kinds of things are really irrational and not in the best interest of the company […] there are CEO’s who don’t know anything about technology, so their trusted advisor is the guy trying to protect his job.

A client of mine in Sydney told me he enquired to his IT department about the use of hosted SharePoint for a multi-organisational project and the reply back was a giant “hell no,” based primarily on fear, uncertainty and doubt. With IT, such FUD is always cloaked in areas of quite genuine risk. There *are* many core questions that we must ask cloud vendors when taking the plunge because to not do so would be remiss (I will end this post with some of those questions). But the key issue is whether the real underlying reason behind those questions is to shut down the debate or to genuinely understand the risks and implications of moving to the cloud.

How can you tell an IT department is likely using a FUD defence? Actually, it is pretty easily because conservative IT is very predictable – they will likely try and hit you with what they think is their slam-dunk counter argument first up. Therefore, they will attempt to bury the discussion with the US Patriot Act Issue. I’ve come across this issue and and Mark Miller at FPWeb mentioned to me that this comes up all the time when they talk about SharePoint hosting to clients. (I am going to cover the Patriot Act issue in the next post because it warrants a dedicated post).

If the Patriot Act argument fails to dent unbridled cloud enthusiasm, the next layer of defence is to highlight cloud based security (identity, authentication and compliance) as well as downtime risk, citing examples such as the September outage of Office 365, SalesForce.com’s well publicized outages, the Amazon outage that took out Twitter, Reddit, Foursquare, Turntable.fm, Netflix and many, many others. The fact that many IT departments do not actually have the level of governance and assurance of their systems that they aspire to will be conveniently overlooked. 

Failing that, the last line of defence is to call into question the commercial viability of cloud providers. We talked about the issues facing the smaller players in the last post, but It is not just them. What if the provider decides to change direction and discontinue a service? Google will likely be cited, since it has a habit of axing cloud based services that don’t reach enough critical mass (the most recent casualty is Google health being retired as I write this).  The risk of a cloud provider going out of business or withdrawing a service is a much more serious risk than when a software supplier fails. At least when its on premise you still have the application running and can use it.

Every FUD defence is based on truth…

Now as I stated above, all of the concerns listed above are genuine things to consider before embarking on a cloud strategy. Prudent business managers and CIOs must weigh the pros and cons of cloud offering before rushing into a deployment that may not be appropriate for their organisation. Equally though, its important to be able to see through a FUD defence when its presented. The easiest way to do this is do some of your own investigations first.

To that end, you can save yourself a heap of time by checking out the work of Richard Harbridge. Richard did a terrific cloud talk at the most recent Share 2011 conference. You can view his slide deck here and I recommend really going through slides 48-81. He has provided a really comprehensive summary of considerations and questions to ask. Among other things, he offered a list of questions that any organisation should be asking providers of cloud services. I have listed some of them below and encourage you to check out his slide deck as it is really comprehensive and covers way more than what I have covered here.

Security Storage Identity & Access
Who will have access to my data?
Do I have full ownership of my data?
What type of employee / contractor screening you do, before you hire them?
How do you detect if an application is being attacked (hacked), and how is that
reported to me and my employees?
How do you govern administrator access to the service?
What firewalls and anti-virus technology are in place?
What controls do you have in place to ensure safety for my data while it is
stored in your environment?
What happens to my data if I cancel my service?
Can I archive environments?
Will my data be replicated to any other datacenters around the world (If
yes, then which ones)?
Do you offer single sign-on for your services?
Active directory integration?
Do all of my users have to rely on solely web based tools?
Can users work offline?
Do you offer a way for me to run your application locally and how quickly I can revert to the local installation?
Do you offer on-premise, web-based, or mixed environments?
     
Reliability & Support Performance  
What is your Disaster Recovery and Business Continuity strategy?
What is the retention period and recovery granularity?
Is your Cloud Computing service compliant with [insert compliance regime here]?
What measures do you provide to assist compliance and minimize legal risk?
What types of support do you offer?
How do you ensure we are not affected by upgrades to the service?
What are your SLAs and how do you compensate when it is not met?
How fast is the local network?
What is the storage architecture?
How many locations do you have and how are they connected?
Have you published any benchmark scores for your infrastructure?
What happens when there is over subscription?
How can I ensure CPU and memory are guaranteed?
 

Conclusion and looking forward…

For some organisations, the lure of cloud solutions is very seductive. From a revenue perspective, it saves a lot of capital expenditure. From a time perspective, it can be deployed very quickly and and from a maintenance perspective, takes the burden away from IT. Sounds like a winner when put that way. But the real issue is that the changing cloud paradigm potentially impacts the wellbeing of some IT professionals and IT departments because it calls into question certain patterns and practices within established roles. It also represents a loss of control and as I said earlier, people often place a higher value on what they will lose compared to what they will gain.

Irrespective of this, whether you are a new age cloud loving CIO or a server hugger, any decision to move to the cloud should be about real business outcomes. Don’t blindly accept what the sales guy tells you. Understand the risks as well as the benefits. Leverage the work Richard has done and ask the cloud providers the hard questions. Look for real world stories (like my second and third articles in this series) which illustrate where the services have let people down.

For some, cloud will be very successful. For others, the gap between expectations and reality will come with a thud.

Thanks for reading

Paul Culmsee

www.sevensigma.com.au

www.hereticsguidebooks.com


The cloud is not the problem-Part 4: Industry shakeout and playing with the big kids…

Hi all

Welcome to the fourth post about the adaptive change that cloud computing is going to have on practitioners, paradigms and organisations. The previous two posts took a look at some of the dodgier side of two of the industries biggest players, Microsoft and Amazon. While I have highlighted some dumb issues with both, I nevertheless have to acknowledge their resourcing, scalability, and ability to execute. On that point of ability to execute, in this post we are going to expand a little towards the cloud industry more broadly and the inevitable consolidation that is, and will continue to take place.

Now to set the scene, a lot of people know that in the early twentieth century, there were a lot of US car manufacturers. I wonder if you can take a guess at the number of defunct car manufacturers there have been before and after that time.

…Fifty?

…One Hundred?

Not even close…

What if I told you that there were over 1700!

Here is another interesting stat. The table below shows the years where manufacturers went bankrupt or ceased operations. Below that I have put the average shelf life of each company for that decade.

Year 1870’s 1880’s 1890’s 1900’s 1910’s 1920’s 1930’s 1940’s 1950’s 1960’s 1970’s 1980’s 1990’s 2000’s 2010’s
# defunct 4 2 5 88 660 610 276 42 13 33 11 5 5 3 5
avg years in operation 5 1 1 3 3 4 5 7 14 10 19 37 16 49 42

Now, you would expect that the bulk of closures would be depression era, but note that the depression did not start until the late 1920’s and during the boom times that preceded it, 660 manufactures went to the wall – a worse result!

The pattern of consolidation

image

What I think the above table shows is the classic pattern of industry consolidation after an initial phase of innovation and expansion, where over time, the many are gobbled by the few. As the number of players consolidate, those who remain grow bigger, with more resources and economies of scale. This in turn creates barriers to entry for new participants. Accordingly, the rate of attrition slows down, but that is more due to the fact that there are fewer players in the industry. Those that are left continue to fight their battles, but now those battles take longer. Nevertheless, as time goes on, the number of players consolidate further.

If we applied a cloud/web hosting paradigm to the above table, I would equate the dotcom bust of 2000 with the depression era of the 1920’s and 1930’s. I actually think with cloud computing, we are in the 1960’s and on right now. The largest of the large players have how made big bets on the cloud and have entered the market in a big, big way. For more than a decade, other companies hosted Microsoft technology, with Microsoft showing little interest beyond selling licenses via them. Now Microsoft themselves are also the hosting provider. Does that mean most the hosting providers will have the fate of Netscape? Or will they manage to survive the dance with Goliath like Citrix or VMWare have?

For those who are not Microsoft or Amazon…

image

Imagine you have been hosting SharePoint solutions for a number of years. Depending on your size, you probably own racks or a cage in some-one else’s data centre, or you own a small data centre yourself. You have some high end VMWare gear to underpin your hosting offerings and you do both managed SharePoint (i.e. offer a basic site collection subscription with no custom stuff – ala Office 365) and you offer dedicated virtual machines for those who want more control (ala Amazon). You have dutifully paid your service provider licensing to Microsoft, have IT engineers on staff, some SharePoint specialists, a helpdesk and some dodgy sales guys – all standard stuff and life is good. You had a crack at implementing SharePoint multi tenancy, but found it all a bit too fiddly and complex.

Then Amazon comes along and shakes things up with their IaaS offerings. They are cost competitive, have more data centres in more regions, a higher capacity, more fault tolerance, a wider variety of services and can scale more than you can. Their ability to execute in terms of offering new services is impossible to keep up with. In short, they slowly but relentlessly take a chunk of the market and continue to grow. So, you naturally counter by pushing the legitimate line that you specialise in SharePoint, and as a result customers are in much more trusted hands than Amazon, when investing on such a complex tool as SharePoint.

But suddenly the game changes again. The very vendor who you provide cloud-based SharePoint services for, now bundles it with Exchange, Lync and offers Active Directory integration (yeah, yeah, I know there was BPOS but no-one actually heard of that). Suddenly the argument that you are a safer option than Amazon is shot down by the fact that Microsoft themselves now offer what you do. So whose hands are safer? The small hosting provider with limited resources or the multinational with billions of dollars in the bank who develops the product? Furthermore, given Microsoft’s advantage in being able to mobilise its knowledge resources with deep product knowledge, they have a richer managed service offering than you can offer (i.e. they offer multi tenancy :).

This puts you in a bit of a bind as you are getting assailed at both ends. Amazon trumps you in the capabilities at the IaaS end and is encroaching in your space and Microsoft is assailing the SaaS end. How does a small fish survive in a pond with the big ones? In my opinion, the mid-tier SharePoint cloud providers will have to reinvent themselves.

The adaptive change…

So for the mid-tier SharePoint cloud provider grappling with the fact that their play area is reduced because of the big kids encroaching, there is only one option. They have to be really, really good in areas the big kids are not good at. In SharePoint terms, this means they have to go to places many don’t really want to go: they need to bolster their support offerings and move up the SharePoint stack.

You see, traditionally a SharePoint hosting provider tends to take two approaches. They provide a managed service where the customer cannot mess with it too much (i.e. Site collection admin access only). For those who need more than that, they will offer a virtual machine and wipe their hands of any maintenance or governance, beyond ensuring that  the infrastructure is fast and backed up. Until now, cloud providers could get away with this and the reason they take this approach should be obvious to anyone who has implemented SharePoint. If you don’t maintain operational governance controls, things can rapidly get out of hand. Who wants to deal with all that “people crap”? Besides, that’s a different skill set to typical skills required to run and maintain cloud services at the infrastructure layer.

So some cloud providers will kick and scream about this, and delude themselves into thinking that hosting and cloud services are their core business. For those who think this, I have news for you. The big boys think these are their core business too and they are going to do it better than you. This is now commodity stuff and a by-product of commoditisation is that many SharePoint consultancies are now cloud providers anyway! They sign up to Microsoft or Amazon and are able to provide a highly scalable SharePoint cloud service with all the value added services further up the SharePoint stack. In short, they combine their SharePoint expertise with Microsoft/Amazon’s scale.

Now on the issue of support, Amazon has no specific SharePoint skills and they never will. They are first and foremost a compelling IaaS offering. Microsoft’s support? … go and re-read part 2 if you want to see that. It seems that no matter the big multinational, level 1 tech support is always level 1 tech support.

So what strategies can a mid-tier provider take to stay competitive in this rapidly commoditising space. I think one is to go premium and go niche.

  • Provide brilliant support. If I call you, day or night, I expect to speak to a SharePoint person straight away. I want to get to know them on a first name basis and I do not want to fight the defence mechanism of the support hierarchy.
  • Partner with SharePoint consultancies or acquire consulting resources. The latter allows you to do some vertical integration yourself and broaden your market and offerings. A potential KPI for any SharePoint cloud provider should be that no support person ever says “sorry that’s outside the scope of what we offer.”
  • Develop skills in the tools and systems that surround SharePoint or invest in SharePoint areas where skills are lacking. Examples include Project Server, PerformancePoint, integration with GIS, Records management and ERP systems. Not only will you develop competencies that few others have, but you can target particular vertical market segments who use these tools.
  • (Controversial?) Dump your infrastructure and use Amazon in conjunction with another IaaS provider. You just can’t compete with their scale and price point. If you use them you will likely save costs, when combined with a second provider you can play the resiliency card and best of all … you can offer VPC 🙂

Conclusion

In the last two posts we looked at some of the areas where both Microsoft and Amazon sometimes struggle to come to grips with the SharePoint cloud paradigm. In this post, we took a look at other cloud providers having to come to grips with the SharePoint cloud paradigm of having to compete with these two giants, who are clearly looking to eke out as much value as they can from the cloud pie. Whether you agree with my suggested strategy (Rackspace appears to), the pattern of the auto industry serves as an interesting parallel to the cloud computing marketplace. Is the relentless consolidation a good thing? Probably not in the long term (we will tackle that issue in the last post in this series). In the next post, we are going to shift our focus away from the cloud providers themselves, and turn our gaze to the internal IT departments – who until now, have had it pretty good. As you will see, a big chunk of the irrational side of cloud computing comes from this area.


Thanks for reading

Paul Culmsee

www.sevensigma.com.au


The cloud is not the problem–Part 3: When silos strike back…

What can Ikea fails tell us about cloud computing?

My next door neighbour is a builder. When he moved next door, the house was an old piece of crap. Within 6 months, he completely renovated it himself, adding in two bedrooms, an underground garage and all sorts of cool stuff. On the other hand, I bought my house because it was a good location, someone had already renovated it and all we had to do was move in. The reason for this was simple: I had a new baby and more importantly, me and power tools do not mix. I just don’t have the skills, nor the time to do what my neighbour did.

You can probably imagine what would happen if I tried to renovate my house the way my neighbour did. It would turn out like the Ikea fails in the video. Similarly, many SharePoint installs tend to look similar to the video too. Moral of the story? Sometimes it is better to get something pre-packaged than to do it yourself.

In the last post, we examined the “Software as a Service” (SaaS) model of cloud computing in the form of Office 365. Other popular SaaS providers include SlideShare, Salesforce, Basecamp and Tom’s Planner to name a few. Most SaaS applications are browser based and not as feature rich or complex as their on-premise competition. Therefore the SaaS model is that its a bit like buying a kit home. In SaaS, no user of these services ever touches the underlying cloud infrastructure used to provide the solution, nor do they have a full mandate to tweak and customise to their hearts content. SaaS is basically predicated on the notion that someone else will do a better set-up job than you and the old 80/20 rule about what features for an application are actually used.

Some people may regard the restrictions of SaaS as a good thing – particularly if they have dealt with the consequences of one too many unproductive customization efforts previously. As many SharePointer’s know, the more you customise SharePoint, the less resilient it gets. Thus restricting what sort of customisations can be done in many circumstances might be a wise thing to do.

Nevertheless, this actually goes against the genetic traits of pretty much every Australian male walking the planet. The reason is simple: no matter how much our skills are lacking or however inappropriate tools or training, we nevertheless always want to do it ourselves. This brings me onto our next cloud provider: Amazon, and their Infrastructure as a Service (IaaS) model of cloud based services. This is the ultimate DIY solution for those of us that find SaaS to cramping our style. Let’s take a closer look shall we?

Amazon in a nutshell

Okay, I have to admit that as an infrastructure guy, I am genetically predisposed to liking Amazon’s cloud offerings. Why? well as an infrastructure guy, I am like my neighbour who renovated his own house. I’d rather do it all myself because I have acquired the skills to do so. So for any server-hugging infrastructure people out there who are wondering what they have been missing out on? Read on… you might like what you see.

Now first up, its easy for new players to get a bit intimidated by Amazon’s bewildering array of offerings with brand names that make no sense to anybody but Amazon… EC2, VPC, S3, ECU, EBS, RDS, AMI’s, Availability Zones – sheesh! So I am going to ignore all of their confusing brand names and just hope that you have heard of virtual machines and will assume that you or your tech geeks know all about VMware. The simplest way to describe Amazon is VMWare on steroids. Amazon’s service essentially allows you to create Virtual Machines within Amazon’s “cloud” of large data centres around the world. As I stated earlier, the official cloud terminology that Amazon is traditionally associated is called Infrastructure as a Service (IaaS). This is where, instead of providing ready-made applications like SaaS, a cloud vendor provides lower level IT infrastructure for rent. This consists of stuff like virtualised servers, storage and networking.

Put simply, utilising Amazon, one can deploy virtual servers with my choice of operating system, applications, memory, CPU and disk configuration. Like any good “all you can eat” buffet, one is spoilt for choice. One simply chooses an Amazon Machine Image (AMI) to use as a base for creating a virtual server. You can choose one of Amazon’s pre-built AMI’s (Base installs of Windows Server or Linux) or you can choose an image from the community contributed list of over 8000 base images. Pretty much any vendor out there who sells a turn-key solution (such as those all-in-one virus scanning/security solutions) has likely created an AMI. Microsoft have also gotten in on the Amazon act and created AMI’s for you, optimised by their product teams. Want SQL 2008 the way Microsoft would install it? Choose the Microsoft Optimized Base SQL Server 2008R2 AMI which “contains scripts to install and optimize SQL Server 2008R2 and accompanying services including SQL Server Analysis services, SQL Server Reporting services, and SQL Server Integration services to your environment based on Microsoft best practices.”

The series of screen shots below shows the basic idea. After signing up, use the “Request instance wizard” to create a new virtual server by choosing an AMI first. In the example below, I have shown the default Amazon AMI’s under “Quick start” as well as the community AMI’s.

image61_thumb1
Amazons default AMI’s
image3_thumb
Community contributed AMI’s

From the list above, I have chosen Microsoft’s “Optimized SQL Server 2008 R2 SP1” from the community AMI’s and clicked “Select”. Now I can choose the CPU and memory configurations. Hmm how does a 16 core server sound with 60 gig of RAM? That ought to do it… 🙂

image13_thumb

Now I won’t go through the full description of commissioning virtual servers, but suffice to say that you can choose which geographic location this server will reside within Amazon’s cloud and after 15 minutes or so, your virtual server will be ready to use. It can be assigned a public IP address, firewall restricted and then remotely managed as per any other server. This can all be done programmatically too. You can talk to Amazon via web services start, monitor, terminate, etc. as many virtual machines as you want, which allows you to scale your infrastructure on the fly and very quickly. There are no long procurement times and you then only pay for what servers are currently running. If you shut them down, you stop paying.

But what makes it cool…

Now I am sure that some of you might be thinking “big deal…any virtual machine hoster can do that.” I agree – and when I first saw this capability I just saw it as a larger scale VMWare/Xen type deployment. But when really made me sit up and take notice was Amazon’s Virtual Private Cloud (VPC) functionality. The super-duper short version of VPC is that it allows you extend your corporate network into the Amazon cloud. It does this by allowing you to define your own private network and connecting to it via site-to-site VPN technology. To describe how it works, diagrammatically check out the image below.

image_thumb13

Let’s use an example to understand the basic idea. Let’s say your internal IP address range at your office is 10.10.10.0 to 10.10.10.255 (a /24 for the geeks). With VPC you tell Amazon “I’d like a new IP address range of 10.10.11.0 to 10.10.11.255” . You are then prompted to tell Amazon the public IP address of your internet router. The screenshots below shows what happens next:

image_thumb14

image6_thumb

The first screenshot asks you to choose what type of router is at your end. Available choices are Cisco, Juniper, Yamaha, Astaro and generic. The second screenshot shows you a sample configuration that is downloaded. Now any Cisco trained person reading this will recognise what is going on here. This is the automatically generated configuration to be added to an organisations edge router to create an IPSEC tunnel. In other words, we have extended our corporate network itself into the cloud. Any service can be run on such a network – not just SharePoint. For smaller organisations wanting the benefits of off-site redundancy without the costs of a separate datacenter, this is a very cost effective option indeed.

For the Cisco geeks, the actual configuration is two GRE tunnels that are IPSEC encrypted. BGP is used for route table exchange, so Amazon can learn what routes to tunnel back to your on-premise network. Furthermore Amazon allows you to manage firewall settings at the Amazon end too, so you have an additional layer of defence past your IPSEC router.

This is called Virtual Private Cloud (VPC) and when configured properly is very powerful. Note the “P” is for private. No server deployed to this subnet is internet accessible unless you choose it to be. This allows you to extend your internal network into the cloud and gain all the provisioning, redundancy and scalability benefits without exposure to the internet directly. As an example, I did a hosted SharePoint extranet where we use SQL log shipping of the extranet content databases back to the a DMZ network for redundancy. Try doing that on Office365!

This sort of functionality shows that Amazon is a mature, highly scalable and flexible IaaS offering. They have been in the business for a long time and it shows because their full suite of offerings is much more expansive than what I can possibly cover here. Accordingly my Amazon experiences will be the subject of a more in-depth blog post or two in future. But for now I will force myself to stop so the non-technical readers don’t get too bored. 🙂

So what went wrong?

So after telling you how impressive Amazon’s offering is, what could possibly go wrong? Like the Office365 issue covered in part 2, absolutely nothing with the technology. To understand why, I need to explain Amazon’s pricing model.

Amazon offer a couple of ways to pay for servers (called instances in Amazon speak). An on-demand instance is calculated based on a per-hour price while the server is running. The more powerful the server is in terms of CPU, memory and disk, the more you pay. To give you an idea, Amazon’s pricing for a Windows box with 8CPU’s and 16GB of RAM, running in Amazon’s “US east” region will set you back $0.96 per hour (as of 27/12/11). If you do the basic math for that, it equates to around $8409 per year, or $25228 over three years. (Yeah I agree that’s high – even when you consider that you get all the trappings of a highly scalable and fault tolerant datacentre).

On the other hand, a reserved instance involves making a one-time payment and in turn, receive a significant discount on the hourly charge for that instance. Essentially if you are going to run an Amazon server on a 24*7 basis for more than 18 months or so, a reserved instance makes sense as it reduces considerable cost over the long term. The same server would only cost you $0.40 per hour if you pay an up-front $2800 for a 3 year term. Total cost: $13312 over three years – much better.

So with that scene set, consider this scenario: Back at the start of 2011, a client of mine consolidated all of their SharePoint cloud services to Amazon from a variety of other another hosting providers. They did this for a number of reasons, but it basically boiled down to the fact they had 1) outgrown the SaaS model and 2) had a growing number of clients. As a result, requirements from clients were getting more complicated and beyond that which most of the hosting providers could cater for. They also received irregular and inconsistent support from their existing providers, as well as some unexpected downtime that reduced confidence. In short, they needed to consolidate their cloud offering and manage their own servers. They were developing custom SharePoint solutions, needed to support federated claims authentication and required disaster recovery assurance to mitigate the risk of going 100% cloud. Amazon’s VPC offering in particular seemed ideal, because it allowed full control of the servers in a secure way.

Now making this change was not something we undertook lightly. We spent considerable time researching Amazon’s offerings, trying to understand all the acronyms as well as their fine print. (For what its worth I used IBIS as the basis to develop an assessment and the map of my notes can be found here). As you are about to see though, we did not check well enough.

Back when we initially evaluated the VPC offering, it was only available in very few Amazon sites (two locations in the USA only) and the service was still in beta. This caused us a bit of a dilemma at the time because of the risk of relying on a beta service. But we were assured when Amazon confirmed that VPC would eventually be available in all of of their datacentres. We also stress tested the service for a few weeks, it remained stable and we developed and tested a disaster recovery strategy involving SQL log shipping and a standby farm. We also purchased reserved instances from Amazon since these servers were going to be there for the long haul, so we pre-paid to reduce the hourly rates. Quite a complex configuration was provisioned in only two days and we were amazed by how easy it all was.

Things hummed along for 9 months in this fashion and the world was a happy place. We were delighted when Amazon notified us that VPC had come out of beta and was now available in any of Amazon’s datacentres around the world. We only used the US datacentre because it was the only location available at the time. Now we wanted to transfer the services to Singapore. My client contacted Amazon about some finer points on such a move and was informed that they would have to pay for their reserved instances all over again!

What the?

It turns out, reserved instances are not transferrable! Essentially, Amazon were telling us that although we paid for a three year reserved instance, and only used it for 9 months, to move the servers to a new region would mean we have to pay all over again for another 3 year reserve. According to Amazon’s documentation, each reserved instance is associated with a specific region, which is fixed for the lifetime of the reserved instance and cannot be changed.

“Okay,” we answer, “we can understand that in circumstances where people move to another cloud provider. But in our case we were not.” We had used around 1/3rd of the reserved instance. So surely Amazon should pro-rata the unused amount, and offer that as a credit when we re-purchase reserved instances in Singapore? I mean, we will still be hosting with Amazon, so overall, they will not be losing any revenue al all. On the contrary, we will be paying them more, because we will have to sign up for an additional 3 years of reserve when we move the services.

So we ask Amazon whether that can be done. “Nope,” comes back the answer from amazons not so friendly billing team with one of those trite and grossly insulting “Sorry for any inconvenience this causes” ending sentences. After more discussions, it seems that internally within Amazon, each region or datacentre within each region is its own profit centre. Therefore in typical silo fashion, the US datacentre does not want to pay money to the Singapore operation as that would mean the revenue we paid would no longer recognised against them.

Result? Customer is screwed all because the Amazon fiefdoms don’t like sharing the contents of the till. But hey – the regional managers get their bonuses right? Sad smile

Conclusion

Like part 2 of this cloud computing series, this is not a technical issue. Amazon’s cloud service in our experience has been reliable and performed well. In this case, we are turned off by the fact that their internal accounting procedures create a situation that is not great for customers who wish to remain loyal to them. In a post about the danger of short termism and ignoring legacy, I gave the example of how dumb it is for organisations to think they are measuring success based on how long it takes to close a helpdesk call. When such a KPI is used, those in support roles have little choice but to try and artificially close calls when users problems have not been solved because that’s how they are deemed to be performing well. The reality though is rather than measure happy customers, this KPI simply rewards which helpdesk operators have managed to game the system by getting callers off the phone as soon as they can.

I feel that Amazon are treating this is an internal accounting issue, irrespective of client outcomes. Amazon will lose the business of my client because of this since they have enough servers hosted where the financial impost of paying all over again is much more than transferring to a different cloud provider. While VPC and automated provisioning of virtual servers is cool and all, at the end of the day many hosting providers can offer this if you ask them. Although it might not be as slick with fancy as Amazon’s automated configuration, it nonetheless is very doable and the other providers are playing catch-up. Like Apple, Amazon are enjoying the benefits of being first to market with their service, but as competition heats up, others will rapidly bridge the gap.

Thanks for reading

Paul Culmsee


« Previous PageNext Page »

Today is: Wednesday 3 June 2026 -