Back to Cleverworkarounds mainpage
 

Learn to talk to your CFO : Collaboration scenario – Part 3

Hi. This is the third article in a series that attempts to explain some financial analysis techniques to non financial oriented IT people. My first two articles in this series were theory and background and this is the first of three scenarios that illustrates an example.

This first scenario is an example of SharePoint as a collaborative solution. It also happens to be the scenario that for my money, carries with it the most risk. But at the same time, SharePoint is well suited to this sort of solution if you follow my branding and document management wisdom 🙂

Continue reading “Learn to talk to your CFO : Collaboration scenario – Part 3”


Darn IIS and Service Packs!

I thought that I was getting pretty good at deciphering odd SharePoint errors. After all, most of the time they are not very friendly! After the subsite/site collection issue of yesterday, you would think I would be in for an easier day today!

But it was not meant to be…

Continue reading “Darn IIS and Service Packs!”


Disk and I/O Sizing for MOSS2007 – Part 2

This is part two of a two part article that discusses techniques for sizing your disk requirements for SharePoint. It is one of a myriad of tasks that you have to perform as part of the planning process, but it is one task that you ideally want to get right the first time, as storage technology can be a potentially high capital cost. I first performed a comprehensive analysis of disk space and performance scalability requirements for a MOSS07 farm back in February 07.

The first article examines some of the tools and techniques you can utilise to help you fill out Microsoft’s sizing worksheet. Part two builds upon this with a real-world example. So to recap from part 1, we have the following stats captured.

Continue reading “Disk and I/O Sizing for MOSS2007 – Part 2”


Disk and I/O Sizing for MOSS2007 – Part 1

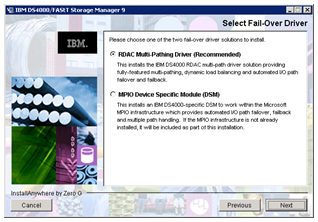
This two part article discusses techniques for sizing your disk requirements for SharePoint. It is one of a myriad of tasks that you have to perform as part of the planning process, but it is one task that you ideally want to get right the first time, as storage technology can be a potentially high capital cost. I first performed a comprehensive analysis of disk space and performance scalability requirements for a MOSS07 farm back in February 07, and at this time, apart from “Yoda Joel“, there was not much out there in relation to planning for SharePoint (particularly in relation to disk sizing). For the record, Joel is *the* ultimate SharePoint all rounder – his blog is essential reading for any SharePoint professional – magnificent stuff. “Give me a ‘J’, give me an ‘O’, give me a”… okay, now that’s definitely getting kinda weird 🙂

Anyway, this post outlines my SharePoint sizing methodology that I employed at that time. What I found personally satisfying about this work, was that when I re-examined this particular farm some months later, the sizing was bang on the money.

So as I mentioned, a lot more material exists now than then, but the information that I did find useful at the time is listed below (it may have been refreshed since I used it):

So here is how I went about disk performance and growth sizing…

The requirements

This client was interested in SharePoint for collaborative document management. They had many projects with teams from 2-100 staff involved. So much of what existed on file servers was to be moved to a SharePoint environment. The growth rate of this company was significant – from 300-1110 staff in less than two years. Hence, as typically happens with such growth, the existing infrastructure, architecture and processed did not cope well with the new scale.

They used a fair amount of files on the existing file server, in the region of 1.2 terabytes. That figure alone is enough to require significant planning across a whole diverse range of SharePoint areas, not just disk space, (I will eventually get around to writing some articles covering these areas as well.). But in additon to the large amount of files on the file server, we had run a pilot SharePoint site for a single smallish project for 2 months prior.

The current regime

So since SharePoint was going to obviously use a lot of document libraries, I initially needed a point of reference to determine the current organic growth in disk space and I/O performance. The Head office had 600 staff,  and two other major regional offices had a large number of staff. I needed to monitor disk usage over time, but as well, I needed estimates on what disk size was in the past.

Using this information, I would be able to interpolate future growth.

So first I talked to the HR department and key management staff to find out the following information for each of the offices:

  • Current staff numbers
  • Estimated staff numbers in 2 years
  • Average growth rate in staff over the last 2 years

From this I derived an annual growth rate in staff numbers per office.

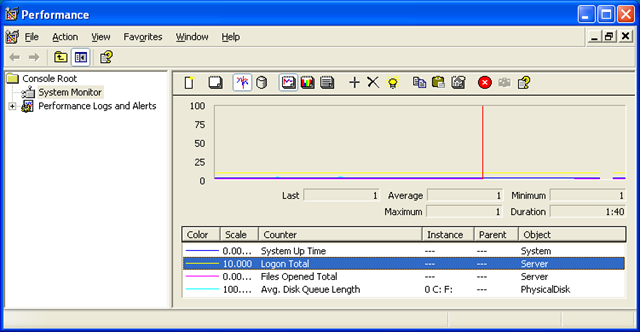
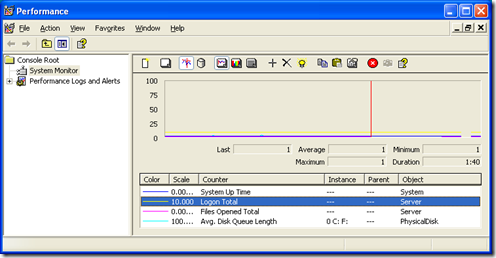
The next step was to examine the current file server performance for each office. This was performed via windows performance monitor (perfmon) and examining specific performance monitor counters. Below are the initial statistics I recorded:

  • System Uptime
  • Total Logons since reboot
  • Logins per minute (total logons / system uptime / 60)
  • Total Opened Files since reboot
  • Files opened per minute Total Opened Files since reboot / system uptime / 60
  • Average Disk Queue length

The specific performance monitor counters are:

  • System\System Up Time
  • Server\Logon Total
  • Server\Files Opened Total
  • PhysicalDisk\Avg. Disk Queue Length

image

Estimating Disk I/O and Growth Requirements

Now it is important to mention here that you cannot take these counters at face value! You need to perform more analysis against these results. For example:

  • The bulk of user data activity happens during office hours to the ‘per hour’ figures need to be further refined.
  • These figures do not break down the type of I/O. So for example, there still exists lame applications who’s idea of multi-user is to run the application from a shared network drive on the server. Such desktop applications running from the server it have the potential to seriously skew your results as there can be a considerable amount of I/O here.
  • Backups will also potentially affect these figures and you should monitor the affect on the above counters that a backup will have on the overall numbers.
  • SharePoint may only be scoped to replace a particular set of files on the server, yet the file count counters show ALL files. You cannot break it down.

So one has to take these overall figures and eventually apply a weighting, which adjust the values to the estimated portion that is relevant to SharePoint. How that weighting is determined is one of the key requirements of a disk analysis methodology.

Now having said that, you could do this via an educated guess, by talking to administration staff to determine a figure, but it would be what project managers call a ‘plus or minus’ 40% estimate. Such estimates are usually termed ‘preliminary estimate’. If this is acceptable, then go with it, since gleaning more accurate information is a time vs. results tradeoff. (I mean hey, if you are a mining company in Perth right now, this is all small change)

But, if you are accountable for the results of this test and you want to cover your butt, then look more into it 🙂 Try and come up with a plus or minus 10% estimate and document how you came up with the figure.

So below are some of the techniques you can use to dig further.

Backup Logs

Examining past backup logs will allow you to infer many things such as:

  • Disk throughput (examine how long the backup took to run versus the amount backed up)
  • The total amount of data backed up
  • The number of files backed up.

More importantly, allows you to get some idea of the organic disk growth over time, if you can view backup reports from say, 1 year ago to now, then it should paint a reasonable picture.

Always make sure that you are only examining the weekly full backup, not the daily incremental or differential backups. It is not uncommon for some data considered of less importance to be only backed up less frequently, so this should be checked also. But my logic here is unless someone has screwed up big time, you can have reasonable confidence that the figures you get from this are based on the actual important data.
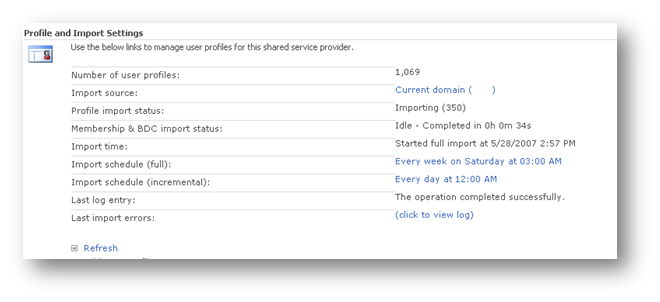
Pilot SharePoint

Running a limited pilot SharePoint production site can be an excellent microcosm of what the eventual full scale production environment will be like. I’ll save the comprehensive article on a pilot installation later. But ideally you limit the pilot scope and affected staff, but still use it in production during this time. It becomes a critical environment to support of course, but the benefit here is it impacts on less staff, allows IT technical and operational personnel to learn the product and starts the ball rolling on governance and other critical issues that need to be addressed. The added bonus is that it allows you to compare what ‘regular’ organic disk space growth is in your environment, to the equivalent growth is when the data is instead in SharePoint. Remember, SharePoint document libraries offer some tremendous productivity enhancements such as version control, indexing and recycle bin affecting space. Later in this article, you will see how I went about estimating disk growth by using a pilot site.

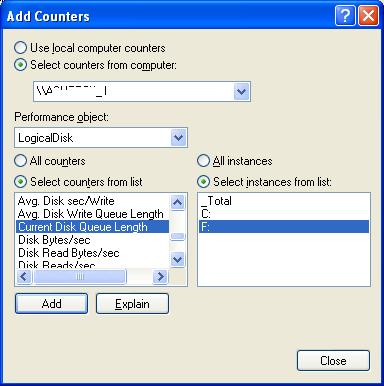
Logical Disk counters

If the administrators of the file server have been clever, they would have split data across different disks or partitions for performance and managability reasons. It is possible to infer from this, the breakdown of file I/O by examining disk performance counters that are collected on a per-partition/disk basis. The best performance monitor counters are the LogicalDisk category, since you can have multiple logical partitions on a single physical disk. Note below I can choose C:\ or F:\ to view the current disk queue length

image

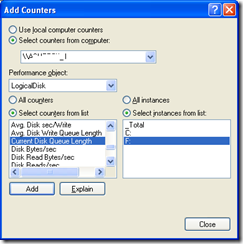
I remember years back that Microsoft considered anything over 2 to indicate a disk under load. Yoda Joel suggests that the figure should stay over 1. I would advise you to heed his advice – Yodas always know best – they are jedi after all!

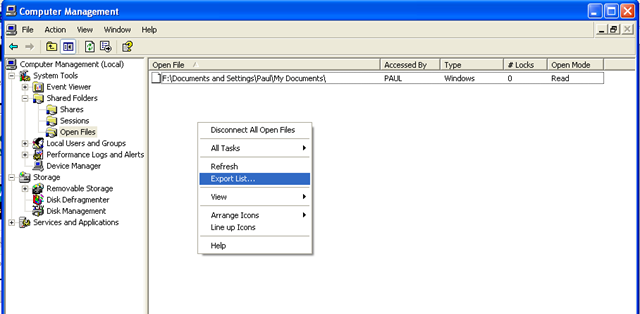
Computer Management – Shared Files

Whilst the previous method is useful for I/O performance, its not granular in terms of file breakdown. Examining the open files in the “Computer Management” MMC also will allow you to perform more detailed analysis. Unfortunately, exporting this data leaves something to be desired and you can only grab the data by right clicking in this window and choosing “Export List”

image

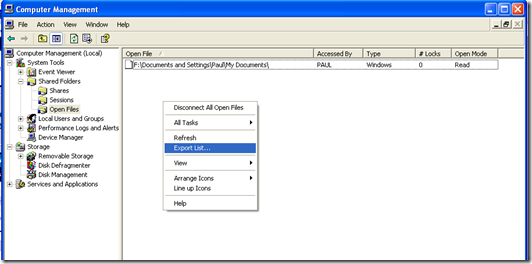
This will generate a tab delimited text file that can be loaded into Excel for further analysis. The columns reported are:

Open File Lists the names of open files. An open file could be a file, a named pipe, a print job in a print spooler, or a resource of an unrecognized type. In some cases, a print job is shown here as an open named pipe
Accessed By The name of the user who has opened the file or accessed the resource
Type Displays the type of network connection: Windows, NetWare, or Macintosh
# Locks Displays the number of application-initiated file locks on the resource
Open Mode Displays the permission that was granted when the resource was opened

Knowing the user that opened the file is very handy as it allows for some other statistics to be inferred.

Other Methods

Unlike my series of articles on branding, I am not going to write an epic 6 part article on performance capturing. But a few other techniques that may be applicable to you depends on the technology and vendor you have. If the servers are SAN connected, you can almost certainly capture detailed disk I/O stats via its management console and likely, SNMP.

A Basic Example

Below is an example of a basic determination of current disk activity with an initial attempt at weighting the numbers.

MYSERVER stats taken 10am – 30/1/2007

  • System Uptime: 551 hours
  • Total Logons since reboot: 927794
  • Logons per minute – 927794 / (551 * 60): 28
  • Total Opened Files since reboot: 114518692
  • Files opened per minute – 114518692 / (551 * 60) : 3463
  • Average Disk Queue length: 2-4

Clearly, on the surface of it, this is a heavily utilized server and before we even think of moving to SharePoint, these figures alone indicate that more analysis is needed. Note that the period in which these statistics were gathered was 10am which is considered a peak time.

MYSERVER is used for shared applications as well as shared files. Luckily all shared applications are stored on E:\APPS.

Here is the breakdown

  • Reported open files in computer management: 1206
  • Number of unique users listed with opened files: 201
  • Number of open files for E:\APPS: 664
  • Number remaining not E:\APPS: 542
  • % of open files to DATA shares: 45%
  • Of non E:\APPS, number of open files (as opposed to folder): 314
  • % of open files versus active listed files (314/1206): 26%

So now we have an idea of the sort of initial weighting to use. At this point, you can move to part 2 of this topic to see how we took these figures and determined both disk I/O throughput as well as disk space sizing

thanks for reading


Optimising SSP User Profile Import – Part 2

In the previous post, we modified the Shared Services Provider to include the Active Directory attribute “country” (code C) in the SharePoint User Profile settings. Now we need to configure a full import from Active Directory and create a test audience to see that it is working.

Task 2: Configuring User Profile Import

Now we need to configure a full import (and the schedule for continual import)

In SharePoint central admin, navigate to Shared Services Administration: User Profile and Properties > Configure Profile Import

  • Import profile data from: Current Domain
  • Default Access Account: <choose an account with Read access to AD>
  • Full Import Schedule: 3:00AM Saturday
  • Incremental Import Schedule: 12:00am every day
  • Now click on “Start Full Import”
  • Click Refresh to review status and then click “Start Full Import”


  • When the import has completed, it will show a status of idle.


  • Optionally click the “View Log” to examine how the import performed..


  • Now click “View User Profiles” and choose a user that you know has the country code set in Active Directory.


Now we have confirmed that we can import country information into SharePoint profiles. We now create audiences based on this attribute.

Task 3: Create the Audience

This section assumes that the user profile import has been successfully been configured and imported.

Shared Services Administration: Manage Audiences

  • Click “Create Audience”
  • Name: “Australia Users”
  • Description: Users who’s base of work is in Australia
  • Owner: <choose an account to be the administrative owner of this audience>
  • Include users who: Satisfy all of the rules


Now we add our rule to be satisfied:

  • Operand/property: Country
  • Operator: =
  • Value: AU


Once the rule has been added, we can we see the audience summary:


  • Click “Compile Audience”. This will attempt to now filter the imported profiles for Country that equals “AU”. In the example below, 87 users matched this criteria


  • Click View membership to confirm country matches


  • Note the custom properties showing the country code as “AU”.
  • Finally, click on “Specify Compilation Schedule”. Set schedule to 4:00am every day (ensures that it takes place after the user profile import)


  • Review the summary. In this example, I also added an audience for another country, and there is always the default audience of all users, so there is a total of 3.


Optimising SSP User Profile Import – Part 1

This post discusses SharePoint User Profiles. In SharePoint 2007, each user has their own profile stored about them and includes properties such as a user’s title, e-mail, distribution list membership, and contact details. It is by default (and required to) import this information from Active Directory, but it can also import from other sources, as well as be manually created directly inside SharePoint. User profiles can be customized in SharePoint to include additional details, such as country of work. User profiles are used throughout SharePoint Server 2007 to disseminate or target information to users, help users locate colleagues with similar interests, and return search results on people.

In this post, I will demonstrate how to import a user’s country in Active Directory into SharePoint as by default, SharePoint does not import this from AD. I am assuming that you have some Active Directory familiarity.

A users country of work is stored and tracked in Active Directory as shown below

ad.JPG

Note the “Country/region” field above.

A component of each Shared Service provider (that I will cover another time) is “User profile import’. By default this is not enabled and if enabled, many Active Directory fields are imported into SharePoint. As previously mentioned however, the user’s country is not a field that is imported by default.

Thus we have three tasks to perform.

  1. Configure the ‘country’ to be imported from Active Directory into SharePoint.
  2. Configure the scheduled import of Active Directory into SharePoint profiles
  3. Create two audiences based on country

Task 1: Add Country to be imported from Active Directory

The first thing we had to do is examine Active directory and find out the distinguished name (DN) of the ‘Country’ property attached to a user. This was performed on a domain controller using the LDP utility.

Click ‘Connection’ Menu and choose connect. Connect to a domain controller.

ldp1.JPG

Click ‘Connection’ menu and choose ‘bind’. Enter domain credentials to bind to Active Directory so its content can be queried.

ldp2.JPG

Click the ‘View’ menu and choose ‘Tree’. Choose your domain in DN format

(eg “DC=co,DC=group,DC=net” for co.group.net)

ldp3.JPG

Now you should be able to browse Active Directory via LDAP view as shown below (image edited to protect the innocent).

ldp4.JPG

Now navigate to the OU that your user accounts reside.

Click on the user account and examine the right pane of LDP. All of the properties associated with that user will be listed. For example here is the left pane showing the user account in an OU called “Internal”

ldp5.JPG

Note to readers: No there is no “Alan Boon” you have witnessed my 3l1t3 mspaint skillz :-)

Expanding base ‘CN=Alan Boon,OU=Internal,OU=Accounts,OU=za,DC=co,DC=group,DC=net’…

Result <0>: (null)Matched DNs: Getting 1 entries:>>

Dn: CN=Alan Boon,OU=Internal,OU=Accounts,OU=za,DC=co,DC=group,DC=net

4> objectClass: top; person; organizationalPerson; user;

1> cn: Alan Boon;

1> sn: Boon;

1> c: ZA;

[snip]

1> mail: alan.boon@somewhere.else

If we examine the output above we can see that line C:ZA.  I have it marked in bold. It shows that the country is South Africa (ZA). Thus, the name of the country property is simply “C”.

So now we need to add the country property to the SharePoint user profile In Central Administration, navigate to Shared Services Administration: SSP_Default > User Profile and Properties

Click “Add profile property” and here are the parameters I entered.

  • Property Settings/Name: Country
  • Property Settings/Display Name: Country
  • Property Settings/Type: String
  • Property Settings/length: 25
  • Property Settings/Allow multiple values: unchecked
  • Property Settings/Allow Choice list: unchecked
  • User Description/Description: Primary country for users work
  • Policy Settings/Policy Setting: Optional
  • Policy Settings/Default Privacy Setting: Everyone
  • Edit Settings: Do not allow users to edit values for this property
  • Display Settings/ Show in the profile properties section of the user’s profile page: checked
  • Display Settings/Show on the edit details page: Checked
  • Display Settings/Show changes in the colleague Tracker Web Part: Checked
  • Search Settings/Alias: unchecked
  • SearchSettings/Indexed: checked
  • Property Import Mapping/Source Data Connection: Master Connection
  • Property Import Mapping/Data source field to map: c

Note the last parameter matches the field name we discovered from Active Directory.

Now we click OK and we can now examine a user profile and see ‘Country’ listed under ‘Custom properties’.

ldp8.JPG

Great! Thats it for now. In part 2 I will cover the user profile import and audience creation based on country. (thats the easy part)


Poor windows explorer view performance in SharePoint?

I found that a 5 server MOSS07 farm was very sluggish in terms of windows explorer view performance compared to a single farm running on a vmware box. This seemed on the surface to make no sense, but some further digging uncovered the issue. I was using a host header and the site name was not the same name as the server itself. However in my VMware farm, the server and site names were the same.

Eg

My WFE server was WEBSERVER1

My Web site was MYWEBSITE

The problem as it turns out is with Windows Server 2003, SMB, and strict name checking.

XP Clients, will by default, use the SMB redirector before using the WebDav redirector. But by default, Windows Server 2003 does not respond to SMB queries that use a server name other than the server’s true NetBIOS name or FQDN. If this is attempted, the server will respond with a STATUS_DUPLICATE_NAME error that looks like this in a Network Monitor trace:

SMB: C session setup & X
SMB: R session setup & X
SMB: C tree connect & X, Share = \\WWW.ADATUM.COM\IPC$
SMB: R tree connect & X – NT error, System, Error, Code = (189) STATUS_DUPLICATE_NAME

Because of the robust nature of the Microsoft SMB implementation, the client will attempt this connection many more times before failing. This can cause significant delays in rendering of the Explorer View.

We can force the server to respond to SMB requests regardless of the server name being used and thereby improving the performance of the SMB portion of the Explorer View protocol negotiation. While this will not result in a successful SMB connection being created, it will result in failing over to WebDAV much faster.

KB article 281308, “Connecting to SMB share on a Windows 2000-based computer or a Windows Server 2003-based computer may not work with an alias name” describes how to use the DisableStrictNameChecking registry key to resolve this problem.

As per the KB article http://support.microsoft.com/kb/281308 I changed the registry key on the affected server.

Start Registry Editor (Regedt32.exe).

  • Locate and click the following key in the registry: HKEY_LOCAL_MACHINE\System\CurrentControlSet\Services\LanmanServer\Parameters
  • On the Edit menu, click Add Value, and then add the following registry value:
  • Value name: DisableStrictNameChecking
  • Data type: REG_DWORD
  • Radix: Decimal
  • Value: 1 
  • Quit Registry Editor.
  • Restart your computer. 


WIFI Security: Background, Risks and Mitigation Part 2

Tags: Cisco,Security,WIFI @ 10:24 am


Like my posts on IT governance standards, I produced this training material some time back when I was doing a lot of IT security work. I’ve since moved onto other IT disciplines, but I hope that this article is of some use to those looking for an introduction to WIFI security. I have divided the material into two parts. The first half is background and theory, and this post illustrates a practical example.

First up, let’s finish off a little theory to go with the first post.

Continue reading “WIFI Security: Background, Risks and Mitigation Part 2”


WIFI Security: Background, Risks and Mitigation Part 1

Tags: Cisco,Security,WIFI @ 9:58 am

Like my posts on IT governance standards, I produced this training material some time back when I was doing a lot of IT security work. I’ve since moved onto other IT disciplines, but I hope that this article is of some use to those looking for an introduction to WIFI security. I have divided the material into two parts. The first half is background and theory, and the second half of a practical example.

I remember when writing it, my audience, although technically savvy did not a have a strong background in cryptography or security. So I tried to make it easy to read, rather than too technical. Not sure if I succeeded! 🙂

Continue reading “WIFI Security: Background, Risks and Mitigation Part 1”


Upgrading HBA controller driver and firmware for IBM Blade

Tags: IBM,Infrastructure,SAN @ 10:56 pm

Seriously.. this particular post is so fringe I wonder if there is any point, given I mostly blog around SharePoint 2007. But hey, governance is critical at all levels and its all well and good to have all this governance at a SharePoint farm level, only to find the underlying infrastructure supporting it is sub-optimally configured or maintained.

For what its worth, I don’t do this sort of work anymore.. its been a long time since geeky low level stuff pushed my buttons. But hey, you never know – maybe someone may find this of some use..

So here we go. This post simply outlines the process of upgrading an IBM blade server to the latest greatest (at the time of writing) drivers, firmware and stuff. The operating system was installed by IBM’s fancy schamzy ServerGuide CD’s. But from my experience with IBM in particular, by the time you rip open the packaging, the CD is out of date and there are much newer versions on IBM’s site. Given that we are talking about disk subsystems, BIOS, drivers and that sort of stuff here, you should ideally ensure you always do a comprehensive check of all components of your server and system infrastructure and make sure you have the latest.

Upgrading this stuff before the server is in production is less risky and allows you to capture really useful information that helps for next time.

Example HBA and storage subsystem driver install for WINDOWS Cluster on IBM BladeServers

1. Qlogic San Surfer management agent

Run the QLogic SANsurfer install program on the blade server and click on the custom button and then click on the Next button:

Deselect everthing except SANsurfer FC Windows Agent (we do not need all the other crap) and click on the Next button:

Click on the Install button:

Click on the Done button:

2. Update the Qlogic drivers

So now that we have the SanSurfer management agent installed, we can use the SanSurfer Administration utility to connect to this server and check things out. You can collect some useful stats from this utility which I will blog about some other time. (I used it to corroborate disk I/O performance as reported by my SAN as well as Windows physicaldisk performance counters)

Anyway I digress. So I am assuming here that you have installed the SanSurfer management components (the stuff you skipped in step 1) onto management PC. So using SANSurfer Administration utility, Connect to the IP of the server running the agent and then click on each HBA/Port listed.

Click UTILITIES tab and click Update Driver and choose “from the Qlogic Website”

If there is a new driver, then you will see a message like the one below

You will be asked to enter a password.. (you can find the default password in the documentation that comes with the blade if you have never set it)

Now the update has completed..

3. Option ROM and Firmware

Note the OS driver was not the only thing upgradable via this utility. It is also possible to upgrade firmware and BIOS for the controller itself

So I went snooping at the IBM website and came across the is the IBM OEM Support page

http://support.qlogic.com/support/oem_detail_all.asp?oemid=224

Listed on this page is:

4Gb Expansion Card ROM Image for HS & LS blades 1.38 4Gb Expansion Card BIOS 1.24, Fcode 1.25, Firmware 4.00.24.

Examination of the current BIOS using SanSurfer showed an older BIOS.

BIOS is 1.04, FW 4.00.23, fcode 1.08

Downloaded ibm_qmix472cf1.38risc4.00.24.zip from the above site and saved it to my PC.

Now back in the SANSurfer GUI, choose UPDATE OPTION ROM

Choose the downloaded zip file

enter password

Reboot the server and check the option rom Information. Well what do you know.. now it matches the version on the IBM OEM site.

4. Install IBM Storage Manager host agent for failover

This site has a nice new IBM SAN, and to achieve redundancy within the SAN, you have to install an IBM component that sets up the HBA’s on the blade for failover. This software came with the SAN and once again I checked IBM’s web site for the latest version.

Here, I used Storage Manager v9.19 for Windows 64-bit\Windows

Choose HOST from the list here.

Choose the RDAC Driver as recommended. This is holding my entire farm and I’ll stick to the recommendation

Restart and hey presto! You will see in a later post my test plan for stress testing this SAN once set up as I test this failover by pulling cables


« Previous PageNext Page »

Today is: Wednesday 3 June 2026 -